Introduction & Overview
Grafana is a powerful open-source platform for monitoring, visualization, and analytics, widely adopted in DevSecOps for its ability to provide actionable insights into system performance, security, and operational health. This tutorial explores Grafana’s core concepts, architecture, setup, use cases, benefits, limitations, and best practices, offering a beginner-to-intermediate guide for technical practitioners in DevSecOps.
What is Grafana?
Grafana is a web-based tool that enables users to create, manage, and share interactive dashboards for visualizing time-series data from various sources. It supports querying, analyzing, and alerting on metrics, making it a cornerstone for observability in modern IT environments.
History or Background
Grafana was created in 2014 by Torkel Ödegaard at Orbitz to address the need for a flexible, source-agnostic visualization tool. Now maintained by Grafana Labs, it has evolved into a leading observability platform, with enterprise and cloud offerings, supporting millions of users worldwide.
Why is it Relevant in DevSecOps?
In DevSecOps, Grafana bridges development, security, and operations by:
- Real-time Monitoring: Tracks application performance and security metrics.
- Security Insights: Visualizes vulnerabilities, compliance status, and threat detection.
- Collaboration: Enables cross-functional teams to share dashboards for unified visibility.
- Automation: Integrates with CI/CD pipelines for proactive issue detection.
Core Concepts & Terminology
Understanding Grafana requires familiarity with its core components:
- Data Source: Systems like Prometheus, Elasticsearch, or AWS CloudWatch that feed data to Grafana.
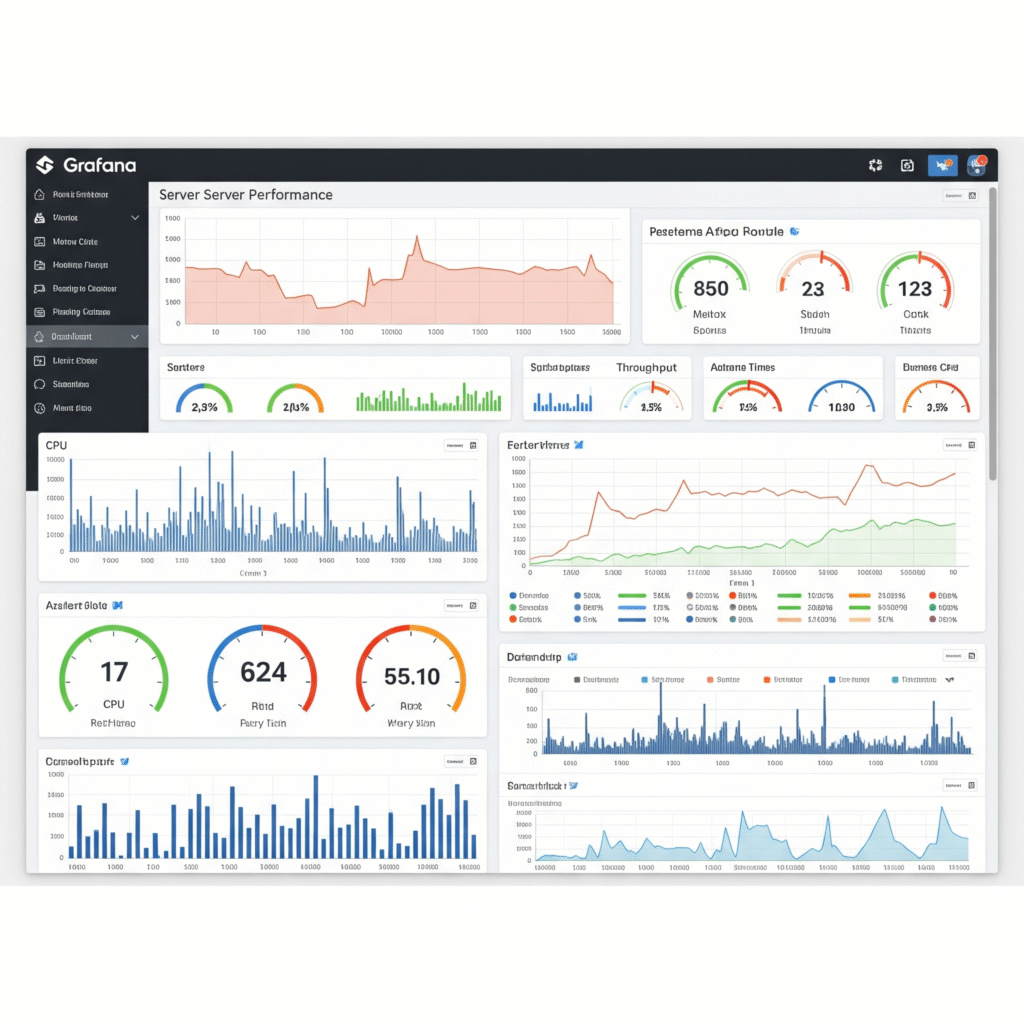
- Dashboard: A collection of panels displaying visualizations (graphs, tables, etc.).
- Panel: Individual visualization elements within a dashboard.
- Query: Instructions to fetch and process data from a data source.
- Alerting: Rules to notify teams when metrics cross predefined thresholds.
| Term | Definition |
|---|---|
| Dashboard | A collection of visual panels displaying metrics. |
| Panel | A single visualization (e.g., graph, table, heatmap). |
| Data Source | Backend system that provides data (e.g., Prometheus, Elasticsearch). |
| Alerting | Rules that trigger notifications based on thresholds. |
| Annotation | Markers on graphs showing events (e.g., deployments). |
How it Fits into the DevSecOps Lifecycle
Grafana supports the DevSecOps lifecycle by:
- Plan: Visualizes requirements and compliance metrics.
- Develop: Monitors code quality and test coverage in CI/CD pipelines.
- Deploy: Tracks deployment health and rollback triggers.
- Operate: Provides operational insights into system performance.
- Secure: Detects anomalies, vulnerabilities, and compliance violations.
Architecture & How It Works
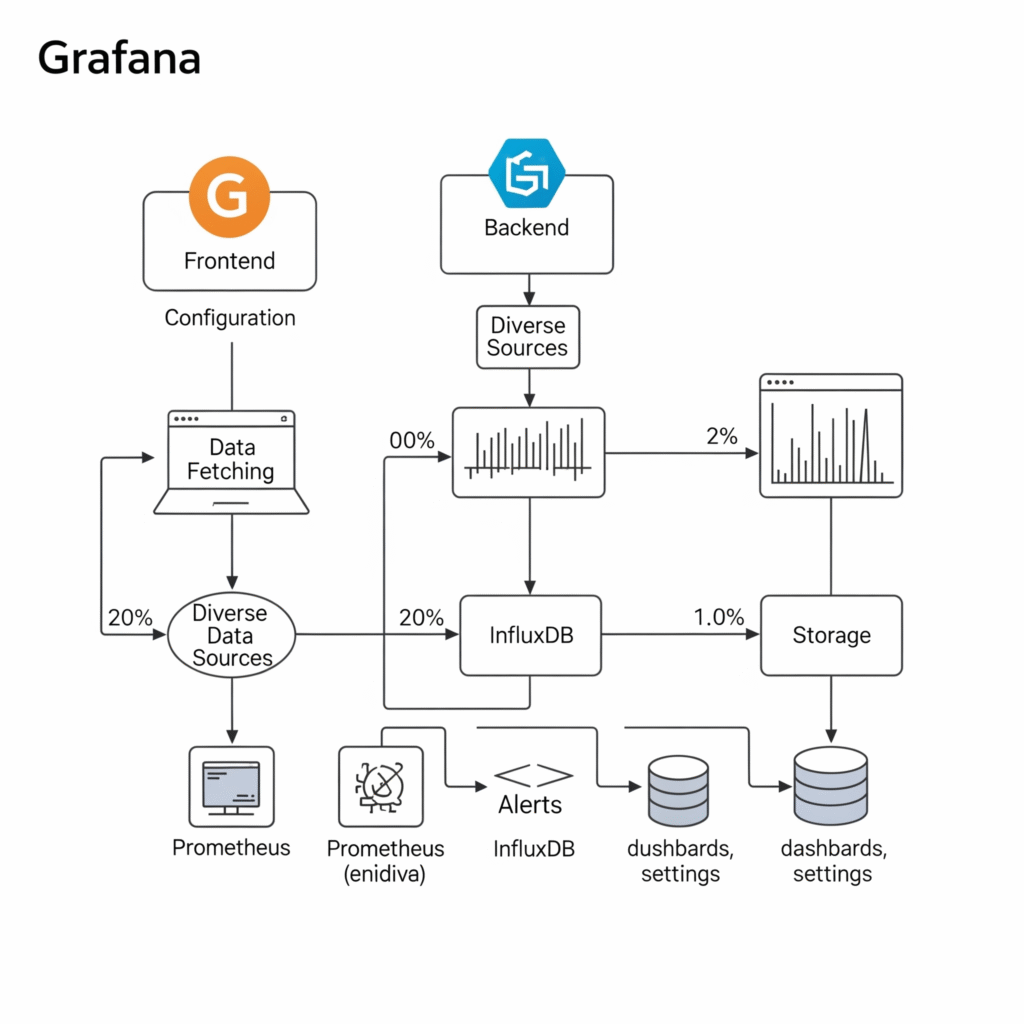
Grafana’s architecture is modular, enabling flexibility and scalability:
- Frontend: A React-based web interface for creating and viewing dashboards.
- Backend: A Go-based server handling data queries, authentication, and alerting.
- Data Sources: Plugins connecting to databases or monitoring tools.
- Storage: Persists dashboards and user configurations (e.g., SQLite, MySQL).
Internal Workflow
- Users configure data sources (e.g., Prometheus).
- Queries fetch data via Grafana’s backend.
- The frontend renders data into dashboards and panels.
- Alerts trigger notifications (e.g., Slack, PagerDuty) based on rules.
Architecture Diagram Description
Imagine a layered diagram:
- Top Layer: Users access dashboards via browsers or APIs.
- Middle Layer: Grafana server processes queries and manages plugins.
- Bottom Layer: Data sources (Prometheus, CloudWatch, etc.) provide raw metrics.
Arrows show bidirectional data flow between layers, with plugins bridging Grafana to external systems.
[ User ] --> [ Grafana Frontend ] --> [ Backend Server ]
                                      |--> [ Prometheus ]
                                      |--> [ Loki ]
                                      |--> [ ElasticSearch ]
                                      |--> [ Alertmanager ]
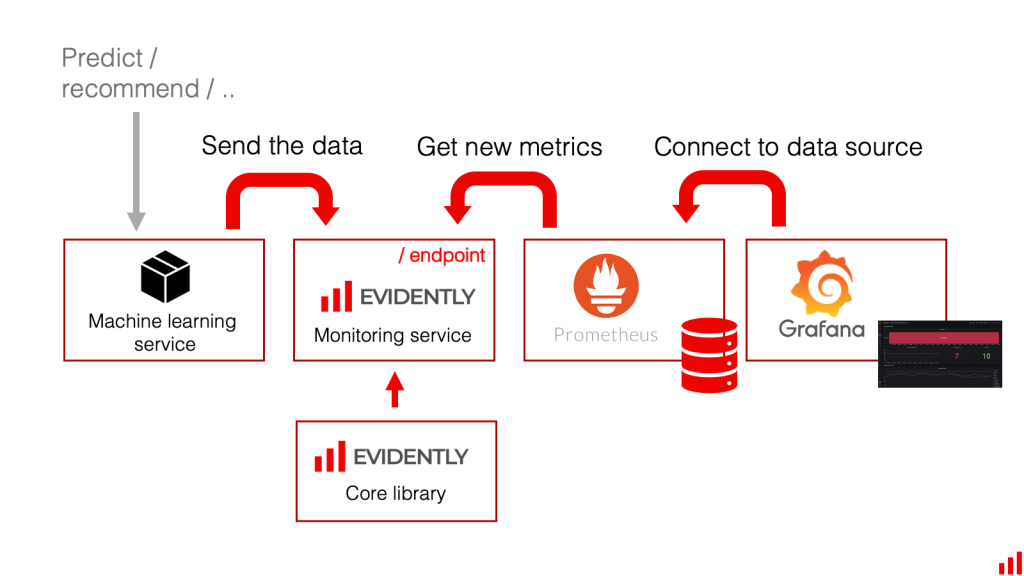
Integration Points with CI/CD or Cloud Tools
Grafana integrates with:
- CI/CD: Jenkins, GitLab CI for pipeline monitoring.
- Cloud: AWS CloudWatch, Azure Monitor, Google Cloud Operations.
- Security: Sysdig, Splunk for threat detection.
- Alerting: PagerDuty, Slack for incident response.
Installation & Getting Started
Basic Setup or Prerequisites
- OS: Linux, macOS, or Windows.
- Requirements: 2GB RAM, 1 CPU core, 2GB disk space.
- Dependencies: A data source (e.g., Prometheus), Docker (optional).
Hands-on: Step-by-Step Beginner-Friendly Setup Guide
This guide installs Grafana on Ubuntu 22.04 using Docker:
- Install Docker:
   sudo apt update
   sudo apt install -y docker.io
sudo systemctl start docker- Pull Grafana Image:
docker pull grafana/grafana:latest- Run Grafana Container:
docker run -d -p 3000:3000 --name grafana grafana/grafana:latest- Access Grafana: Open http://localhost:3000 in a browser. Default login: admin/admin.
- Add Data Source (e.g., Prometheus):
- Navigate to Configuration > Data Sources.
- Select Prometheus, enter URL (e.g., http://prometheus:9090).
- Save and test the connection.
- Create a Dashboard:
- Go to Dashboards > New Dashboard.
- Add a panel, select a data source, and write a query (e.g., rate(http_requests_total[5m])).
- Save the dashboard.
Real-World Use Cases
Grafana shines in DevSecOps through these scenarios:
- Pipeline Monitoring: Tracks CI/CD pipeline performance (e.g., build times, failure rates) using Jenkins or GitLab data sources.
- Security Monitoring: Visualizes vulnerabilities from tools like Sysdig, showing real-time threat alerts in a Kubernetes cluster.
- Compliance Tracking: Monitors compliance metrics (e.g., SOC 2, GDPR) by integrating with audit logs in Elasticsearch.
- Infrastructure Health: Displays cloud resource usage (e.g., AWS EC2 CPU metrics) for proactive scaling and cost management.
Industry-Specific Examples
- Finance: Banks use Grafana to monitor transaction latencies and detect fraud patterns via anomaly detection.
- Healthcare: Hospitals track system uptime and patient data access logs to ensure HIPAA compliance.
Benefits & Limitations
Key Advantages
- Flexibility: Supports 80+ data sources, from Prometheus to PostgreSQL.
- Visualization: Rich, customizable dashboards for diverse use cases.
- Open Source: Free core version with active community support.
- Alerting: Integrates with modern notification tools for rapid response.
Common Challenges or Limitations
- Complexity: Steep learning curve for advanced queries and plugins.
- Scalability: Requires tuning for large-scale deployments.
- Dependency: Relies on external data sources for functionality.
Best Practices & Recommendations
- Security Tips:
- Enable SSO (e.g., OAuth) for secure access.
- Use role-based access control (RBAC) to limit dashboard permissions.
- Encrypt connections with TLS/SSL.
- Performance:
- Optimize queries to reduce data source load.
- Use caching for frequently accessed dashboards.
- Maintenance:
- Regularly update Grafana and plugins.
- Backup dashboards using JSON exports.
- Compliance Alignment: Map dashboards to standards like GDPR or SOC 2 for audit readiness.
- Automation Ideas: Use Grafana APIs to provision dashboards in CI/CD pipelines.
Comparison with Alternatives
| Feature | Grafana | Kibana | Prometheus Web UI |
|---|---|---|---|
| Data Source Support | 80+ (Prometheus, etc.) | Elasticsearch | Prometheus only |
| Visualization | Highly customizable | Moderate | Basic |
| Alerting | Robust, multi-channel | Limited | Basic |
| Open Source | Yes | Yes | Yes |
| Ease of Use | Moderate | Complex | Simple |
When to Choose Grafana
- Choose Grafana for multi-source environments and customizable dashboards.
- Opt for Kibana if tied to Elasticsearch or log-heavy workflows.
- Use Prometheus Web UI for lightweight, Prometheus-only monitoring.
Conclusion
Grafana is a versatile tool for DevSecOps, enabling teams to monitor, secure, and optimize systems through unified observability. Its flexibility and integration capabilities make it a go-to solution for modern IT environments. Future trends include AI-driven anomaly detection and deeper cloud-native integrations. To get started, explore Grafana’s official documentation at https://grafana.com/docs/ and join its vibrant community on GitHub or the Grafana Slack.


Leave a Reply
You must be logged in to post a comment.