Introduction
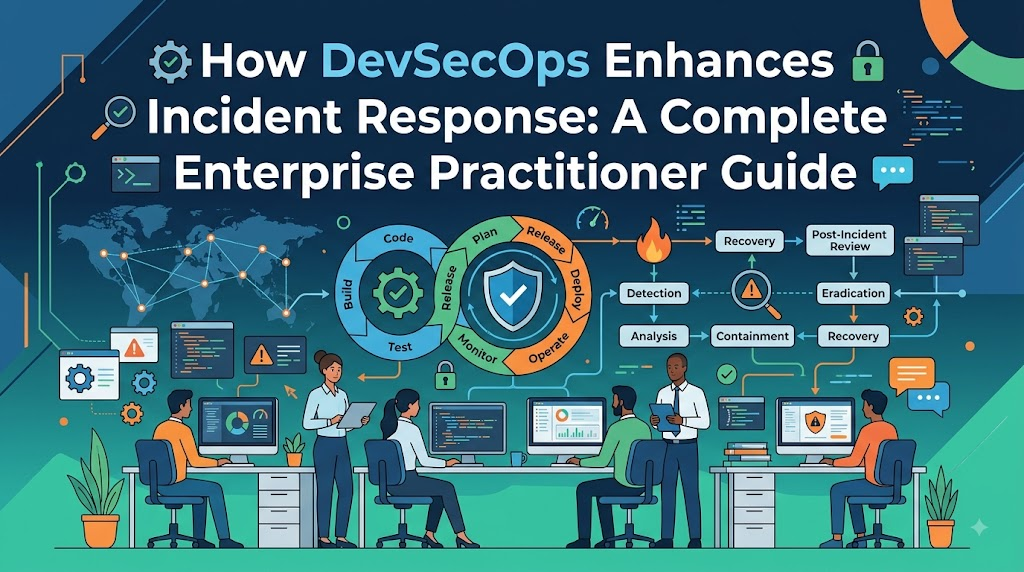
Modern enterprise software operates at a scale and speed where traditional operational boundaries can no longer guarantee stability, making immediate and systematic incident response critical to safeguarding business continuity. Historically, isolated silos between development, operations, and security teams created communication barriers and prolonged investigation cycles during production events. DevSecOps transforms this dynamic by embedding security principles and validation checkpoints across the entire delivery lifecycle, creating continuous feedback that improves preparedness, system visibility, cross-team collaboration, and recovery. Platforms such as DevOpsSchool champion these modern operational philosophies, equipping engineering teams with the technical capabilities required to manage resilient, secure delivery ecosystems.
What Is Incident Response?
Incident response is a structured, repeatable methodology that engineering and security teams use to identify, investigate, manage, contain, and remediate unexpected operational disruptions and security events. Its primary objective is to limit system impact, reduce downtime, safeguard data integrity, and restore normal business operations as quickly and safely as possible.
Preparation
    ↓
Detection
    ↓
Analysis
    ↓
Containment
    ↓
Eradication
    ↓
Recovery
    ↓
Lessons Learned
The incident-response lifecycle comprises seven essential stages:
- Preparation: Developing operational runbooks, establishing communication channels, setting up monitoring tools, configuring access policies, and training engineering teams before an event occurs.
- Detection: Identifying anomalies, policy violations, or performance regressions using proactive alerts, telemetry streams, and security monitoring tools.
- Analysis: Validating findings, determining scope, establishing root cause, and understanding the broader operational impact across workloads.
- Containment: Applying immediate, controlled actions to isolate affected components, restrict unauthorized network traffic, or disable compromised service accounts to stop further disruption.
- Eradication: Removing the underlying cause of the issue, such as eliminating insecure configurations, applying software patches, or rolling back flawed deployments.
- Recovery: Restoring systems to a validated healthy state, verifying workload health, running regression tests, and carefully bringing production traffic back online.
- Lessons Learned: Conducting blameless post-incident reviews to identify why the event occurred, what worked during response, and how automation and architecture can prevent recurrence.
Incident response is not limited to external security intrusions. A robust incident-response framework addresses diverse system disruptions, including:
- Security Incidents: Unauthorized access attempts, credential compromises, exposed secrets, or anomalous data transfers.
- Application Failures: Memory leaks, unhandled exceptions, race conditions, or broken third-party dependencies impacting uptime.
- Infrastructure Incidents: Node failures, disk exhaustion, network routing loops, or compute capacity shortages.
- Cloud Security Events: Accidental public storage permissions, unexpected security group modifications, or anomalous cross-region API activities.
- Data Exposure Events: Unencrypted backups, overly broad database access policies, or misplaced sensitive logs.
- Unauthorized Access: Privilege escalations, stale contractor accounts, or compromised API tokens.
- Configuration Problems: Misconfigured environment variables, syntax errors in deployment manifests, or inconsistent ingress routing rules.
Managing these incidents effectively requires clear alignment between technical responders, engineering leadership, and business stakeholders. When engineering teams possess a common technical context, investigations proceed smoothly without internal friction.
What Is DevSecOps?
DevSecOps is the cultural, architectural, and technical practice of integrating security testing, compliance validation, and risk management directly into every stage of the DevOps software delivery lifecycle. Rather than treating security as an external gating mechanism that halts releases, DevSecOps distributes security ownership across developers, operations engineers, site reliability engineers (SREs), and dedicated security specialists.
Plan → Code → Build → Test → Secure → Release → Deploy → Monitor → Respond → Improve
Within a mature DevSecOps workflow, security operates as an automated, continuous capability:
- Plan: Threat modeling, security requirements definition, and architecture risk reviews occur during backlog grooming.
- Code: Integrated development environment (IDE) linters and local pre-commit hooks catch hardcoded secrets, insecure functions, and code quality issues.
- Build: Automated build systems compile source code and verify software component integrity.
- Test: Unit tests, integration suites, and dynamic tests evaluate functional correctness under varied conditions.
- Secure: Static Application Security Testing (SAST), Software Composition Analysis (SCA), and Infrastructure as Code (IaC) linting run automatically within pipelines.
- Release: Cryptographic signing of artifacts and supply-chain provenance checks ensure only verified binaries are approved.
- Deploy: Progressive deployment strategies (canary, blue-green) push immutable infrastructure changes into production environments.
- Monitor: Centralized logging, distributed tracing, and metric collection observe runtime workload behavior.
- Respond: Automated runbooks, telemetry-driven alerts, and incident-response teams handle operational anomalies.
- Improve: Post-incident findings, vulnerability trends, and operational metrics are fed back into sprint planning to harden future releases.
By distributing security throughout the delivery pipeline, security transformations shift from infrequent, painful audits into continuous, manageable engineering improvements.
Why Traditional Incident Response Can Be Slow
Traditional incident-response processes often struggle to keep pace with dynamic, distributed architectures. When infrastructure is configured manually and applications are deployed on ad-hoc schedules, teams face several systemic bottlenecks during investigations:
- Security Silos: Security teams operate independently from development and operations, lacking immediate insight into recent code deployments, configuration updates, or application architectural changes.
- Limited Visibility: Applications generate unstructured, uncoordinated telemetry, forcing responders to piece together disparate log files across multiple servers during an active outage.
- Manual Investigation: Responders must manually log into individual servers via SSH, query disparate databases, and run manual scripts to extract diagnostic evidence.
- Incomplete Logs: Services lack standardized logging conventions, missing essential context such as correlation IDs, source IP addresses, and accurate timestamps.
- Unclear Ownership: Teams spend critical early minutes or hours debating whether an alert belongs to application developers, database administrators, or platform engineers.
- Slow Vulnerability Information: Organizations lack a real-time software bill of materials (SBOM), requiring days of manual codebase audits to determine if a newly disclosed vulnerability affects active production systems.
- Manual Environment Recovery: Rebuilding a corrupted or compromised virtual machine requires tedious manual system administration, introducing human error and prolonged recovery windows.
- Poor Documentation: Operational runbooks are stored in stale wikis or static documents that fail to reflect recent architectural changes.
- Delayed Communication: Incident updates are sent through fragmented email chains rather than structured, real-time collaboration channels.
These operational inefficiencies significantly increase the Mean Time to Detect (MTTD), Mean Time to Investigate (MTTI), and Mean Time to Recover (MTTR), allowing minor operational anomalies to escalate into widespread system outages.
How DevSecOps Changes Incident Response
DevSecOps transforms incident response from a reactive, manual exercise into an observable, automated, and continuous operational feedback loop. When software delivery is automated and infrastructure is expressed as code, teams approach incident management with shared context, repeatable tooling, and comprehensive traceability.
| Dimension | Traditional Approach | DevSecOps Approach |
| Security Validation | Late, manual reviews prior to release | Continuous automated checks across the pipeline |
| Investigation | Manual log collection and ad-hoc SSH access | Centralized telemetry and automated evidence capture |
| Team Structure | Siloed teams with conflicting priorities | Cross-functional collaboration and shared metrics |
| System Visibility | Fragmented, reactive monitoring | Comprehensive, continuous observability and tracing |
| Environment Recovery | Manual reconfiguration and patching | Automated, repeatable rebuilds via Infrastructure as Code |
| Learning Process | Infrequent, siloed reviews | Continuous feedback driving automated guardrails |
DevSecOps does not replace the need for specialized incident-response personnel. Instead, it provides security analysts and incident responders with rich telemetry, automated deployment pipelines, and reproducible infrastructure, allowing them to make fast, informed decisions.
Security as a Continuous Feedback Loop
In a DevSecOps model, incident response is not an isolated post-event activity. It is an integral phase of a continuous engineering feedback loop that constantly validates, measures, and refines system security.
Code Change
    ↓
Security Validation
    ↓
Deployment
    ↓
Runtime Monitoring
    ↓
Security Signal
    ↓
Investigation
    ↓
Response
    ↓
Learning
    ↓
Improved Controls
When a developer submits a code change, automated pipeline tests validate its safety. Once deployed, runtime observability tools track service behavior against historical baselines. If an anomalous security signal or operational failure appears, responders investigate using centralized telemetry.
Once the immediate event is contained and remediated, the root cause is analyzed to design new automated pipeline tests, policy-as-code rules, or runtime alerts. This continuous cycle ensures that an organization systematically hardens its defenses after every detected anomaly.
DevSecOps and Incident Preparedness
True incident readiness begins long before an alert fires. DevSecOps principles establish a proactive foundation across processes, tooling, and infrastructure to ensure teams can respond methodically under pressure.
Key components of DevSecOps incident preparedness include:
- Living Incident-Response Plans: Version-controlled response plans that are reviewed and updated alongside software architecture changes.
- Actionable Runbooks: Step-by-step diagnostic and remediation playbooks maintained in shared repositories and accessible directly from monitoring dashboards.
- Clear Escalation Paths: Programmatic paging and on-call rotations configured through tools that automatically route alerts based on service ownership metadata.
- Security Policies as Code: Explicit, machine-enforceable rules that define baseline resource configurations, network boundaries, and access restrictions.
- Strict Access Controls: Principle of least privilege enforced across cloud control planes, container clusters, and deployment pipelines.
- Standardized Logging: Unified logging schemas implemented across all microservices to guarantee timestamp accuracy, trace propagation, and contextual metadata.
- Continuous Monitoring: Real-time metrics and tracing pipelines configured during initial service scaffolding rather than added as an afterthought.
- Automated Backup Strategies: Scheduled, encrypted, and regularly validated data backups with clear retention policies.
- Tested Recovery Procedures: Automated scripts and deployment pipelines capable of standing up replacement workloads in alternate regions or clusters.
- Incident Simulations: Regular tabletop exercises, chaos engineering experiments, and game days where engineering teams simulate outages and security events in staging environments.
Preparation eliminates confusion during high-severity events, enabling responders to execute validated procedures with confidence.
Security Testing Before Production
Finding and resolving security defects early in the software lifecycle drastically reduces the attack surface and operational instability of production systems. When vulnerabilities are caught prior to deployment, fewer unexpected failures occur at runtime.
Code → Security Check → Finding → Fix → Validation
DevSecOps integrates several automated testing layers into the pre-production workflow:
- Static Application Security Testing (SAST): Scans raw source code for structural flaws, injection risks, insecure cryptographic routines, and unsafe syntax.
- Software Composition Analysis (SCA): Catalogs open-source dependencies and identifies known Common Vulnerabilities and Exposures (CVEs) before libraries are bundled into builds.
- Secret Detection: Analyzes code repositories, configuration files, and commit histories to prevent API keys, database credentials, and certificates from being pushed upstream.
- Container Image Scanning: Evaluates base operating system layers and packaged dependencies inside container images for unpatched vulnerabilities and improper configurations.
- Infrastructure as Code (IaC) Validation: Scans Terraform, CloudFormation, Helm charts, and Kubernetes manifests for overly permissive security groups, unencrypted volumes, or open ingress rules.
- Configuration Linting: Validates environment manifests against organizational compliance standards and CIS benchmarks.
- Dynamic API Security Testing: Exercises live staging endpoints with automated requests to identify authentication bypasses, broken object-level authorization, and data leakage.
Catching these issues in development branches prevents vulnerabilities from ever reaching production, allowing incident responders to focus on novel operational events rather than recurring, preventable flaws.
CI/CD Security and Incident Response
Continuous Integration and Continuous Deployment (CI/CD) pipelines are the backbone of modern delivery, making their security, integrity, and auditability essential for incident response.
Commit → Build → Security Validation → Test → Artifact → Deployment → Audit Trail
A secured CI/CD pipeline reinforces incident response through several key capabilities:
- Security Gates: Automated policy checks that prevent builds containing critical vulnerabilities, high-risk misconfigurations, or unapproved dependencies from advancing to production.
- Artifact Validation: Cryptographic signing of binaries and container images (e.g., using Sigstore/Cosign) to ensure that only unmodified, verified builds are deployed to runtime environments.
- Deployment Policies: Declarative release configurations enforcing progressive rollouts, automated health checks, and automatic rollback triggers upon failure detection.
- Environment Controls: Strict isolation between build runners, staging environments, and production networks to prevent lateral movement during supply-chain compromises.
- Approval Mechanisms: Enforced peer code reviews, multi-party sign-offs for sensitive pipeline stages, and branch protection rules.
- Immutable Audit Trails: Granular, tamper-resistant commit histories, build logs, test outputs, and deployment metadata that allow responders to trace any production artifact directly back to its source commit, author, and review history.
During an active incident, this traceability enables responders to identify exactly when a faulty change was merged, who approved it, and what specific code modifications were introduced.
Vulnerability Management and Incident Response
Vulnerability management and incident response are deeply interconnected. Understanding which assets are vulnerable across an enterprise provides the situational awareness required to prioritize alarms and contain threats quickly.
A mature DevSecOps vulnerability management workflow incorporates:
- Continuous Vulnerability Identification: Automated, ongoing scanning across code repositories, container registries, virtual machines, and cloud environments.
- Risk Prioritization: Scoring vulnerabilities based on real-world exploitability, network exposure, and the criticality of the underlying service, rather than relying solely on raw CVSS scores.
- Asset Ownership Mapping: Explicitly linking software repositories, container images, and cloud resources to designated engineering teams using service catalogs and metadata tagging.
- Patch Status Visibility: Maintaining continuous dashboards showing which clusters, images, and compute instances have received security patches and which remain outdated.
- Exposure Assessment: Quickly cross-referencing newly disclosed zero-day vulnerabilities against the centralized Software Bill of Materials (SBOM) to pinpoint vulnerable running workloads.
- Remediation Tracking: Automatically generating tracking tickets, assigning them to responsible teams with defined Service Level Agreements (SLAs), and monitoring fix progress.
- Verification Checks: Automatically running pipeline scans to confirm that submitted pull requests successfully resolve reported vulnerabilities without introducing regressions.
When an incident occurs, responders can immediately determine whether an alerted service contains known, exploitable vulnerabilities, allowing them to form targeted investigation hypotheses without delay.
Logging and Security Incident Investigation
Comprehensive, centralized logging provides the objective historical record required to reconstruct incident timelines, establish scope, and understand technical failures.
Event → Log Collection → Correlation → Investigation → Decision → Response
To support rapid investigations, DevSecOps platforms centralize diverse log streams:
- Application Logs: Structured JSON logs capturing application-level events, error traces, user actions, and transaction statuses.
- Authentication Logs: Records of successful and failed login attempts, multi-factor authentication challenges, and credential updates.
- Access Logs: HTTP request logs from ingress controllers, API gateways, and web servers detailing client IPs, user agents, endpoints, and response codes.
- Infrastructure Logs: Operating system syslog events, kernel messages, service state changes, and hardware health metrics.
- Cloud Activity Logs: Control-plane audit logs (such as AWS CloudTrail or GCP Cloud Audit Logs) tracking API calls, resource modifications, and permission updates.
- CI/CD Logs: Execution histories capturing pipeline runs, environment variable usage, artifact generation, and deployment triggers.
- Security Events: Alert logs from web application firewalls, host-based intrusion detection agents, and vulnerability scanners.
To remain effective during high-pressure investigations, logging architectures must ensure:
- Accurate Timestamps: All nodes synchronized via Network Time Protocol (NTP) using UTC to maintain consistent event sequencing.
- Consistent Logging Schemas: Standard field names (e.g.,
client_ip,user_id,trace_id) across all services to enable unified querying. - Appropriate Retention Periods: Balancing storage costs with investigation requirements to support long-tail post-incident analyses.
- Strict Access Control: Restricting access to centralized log repositories using role-based access control (RBAC) to protect sensitive diagnostic data.
- Log Integrity Protection: Utilizing write-once-read-many (WORM) storage or cryptographic log signing to prevent tampering or log deletion.
Observability and Security Incident Detection
Observability extends traditional monitoring by enabling engineers to understand the internal state of complex systems based on their external outputs. While monitoring tells responders that a system is failing, observability helps them understand why it is failing.
A modern observability framework synthesizes five core telemetry signals:
- Logs: Contextual records of discrete events containing descriptive metadata and stack traces.
- Metrics: Aggregated numerical data points measured over time, such as CPU utilization, request rates, error percentages, and memory pressure.
- Traces: End-to-end representations of a request’s journey across distributed microservices, highlighting latency bottlenecks and failed downstream calls.
- Events: Significant operational milestones, such as container restarts, autoscaling triggers, deployments, and configuration updates.
- Alerts: Actionable notifications generated when telemetry exceeds defined thresholds or matches known anomaly patterns.
DevSecOps correlates application performance signals with security telemetry to uncover complex issues:
Unexpected Application Behavior
    ↓
Telemetry Review (Metrics & Traces)
    ↓
Authentication Activity (Audit Logs)
    ↓
Infrastructure Activity (Host Metrics)
    ↓
Security Investigation
For instance, an sudden spike in database latency (Metric) might correlate with a high volume of failed authentication attempts (Log) and an unusual egress connection from a worker node (Network Trace). Observability bridges the gap between infrastructure health and security posture.
Automated Detection and Alerting
Automated detection systems process vast streams of operational and security telemetry in real time, identifying abnormal patterns and notifying engineering teams before minor issues escalate into major outages.
Effective detection mechanisms utilize multiple analysis techniques:
- Threshold-Based Alerts: Alerts triggered when quantifiable metrics exceed predefined safe limits (e.g., error rate exceeding 2% over a five-minute window).
- Rule-Based Detection: Signatures identifying known operational failure states or suspicious patterns (e.g., repeated privilege escalation attempts or unauthorized configuration updates).
- Anomaly Signals: Machine learning baselines that flag deviations from normal traffic, such as unexpected API calls during off-hours or sudden spikes in outbound data transfers.
- Event Correlation: Engines that connect multiple weak signals—such as a configuration change followed immediately by elevated container restarts—into a single high-priority incident.
- Automated Notifications: Targeted alerts dispatched directly to on-call engineers via integrated chat and paging platforms, enriched with direct links to relevant dashboards.
To maintain operational effectiveness, teams must actively combat alert fatigue. High-volume, low-fidelity alerts desensitize responders and cause critical signals to be overlooked. Alerts must be actionable, contextual, directly assigned to clear service owners, and continuously tuned to eliminate noisy false positives.
Automated Incident Response
Automated response mechanisms allow systems to execute immediate, defensive actions to contain failures and collect evidence without waiting for manual human intervention. However, automation must always be implemented responsibly with strict guardrails.
Appropriate examples of defensive automation include:
- Incident Ticket Creation: Automatically generating tracking tickets with relevant logs, error traces, and impacted asset details when an alert fires.
- Automated Evidence Collection: Capturing system memory dumps, process lists, and recent network connection states the moment an anomaly is detected on a host.
- State Snapshots: Taking point-in-time snapshots of affected virtual machine disks or databases to preserve diagnostic evidence for later analysis.
- Responder Notifications: Paging the designated on-call engineer and spinning up a dedicated incident collaboration channel automatically.
- Targeted Identity Suspension: Disabling or revoking active session tokens for a service account exhibiting verified anomalous behavior under approved policies.
- Resource Isolation: Moving a suspicious container or instance into an isolated quarantine network security group to prevent lateral communication.
- Automated Recovery Triggers: Initiating blue-green traffic switching or spinning up replacement instances when health checks fail repeatedly.
Detection → Validation → Decision → Automated Action → Verification → Human Review
High-impact automated actions must always include safeguard mechanisms, explicit operational boundaries, rollback procedures, and mandatory human review to prevent automation logic from worsening an ongoing outage.
Infrastructure as Code and Incident Recovery
Infrastructure as Code (IaC) allows teams to define, provision, and manage servers, networks, load balancers, and security policies using declarative configuration files. This practice transforms environment recovery from an error-prone manual task into a fast, repeatable deployment process.
Known Configuration → Validated IaC → Rebuild → Test → Recover
IaC strengthens incident recovery through several core advantages:
- Version-Controlled Infrastructure: Every infrastructure modification is recorded in Git, providing complete visibility into who changed what resource, when, and why.
- Reproducible Environments: Staging and disaster-recovery environments can be stood up with identical configurations, network policies, and access controls within minutes.
- Configuration Consistency: Eliminates configuration drift across production servers, ensuring all nodes run identical, validated baseline configurations.
- Automated Environment Rebuilding: Compromised, corrupted, or degraded virtual machines and container clusters can be torn down and reprovisioned from clean, validated templates rather than manually repaired.
- Rapid Rollback Capabilities: If an infrastructure change introduces stability issues, teams can revert the Git commit and apply the previous known-good state via the CI/CD pipeline.
By eliminating manual configuration steps, IaC drastically reduces recovery times and ensures that replacement systems are configured securely and correctly.
Containers and Kubernetes Incident Response
Containerized architectures and Kubernetes orchestration introduce unique operational and security considerations that influence how incidents are detected, investigated, and contained.
Key container and orchestration factors include:
- Ephemeral Workloads: Because containers can terminate or restart within seconds, diagnostic logs and memory states must be streamed off-host immediately to prevent evidence loss.
- Container Image Provenance: Verifying that running containers match approved, immutable base images stored in secure, private container registries.
- Pod Behavior Monitoring: Tracking unexpected process execution, file modifications in read-only layers, or abnormal network connections inside running pods.
- Service-to-Service Communication: Managing and monitoring inter-service traffic via service meshes (e.g., mTLS encryption, network access policies, and traffic telemetry).
- Kubernetes Secrets Management: Ensuring sensitive credentials are injected securely as environment variables or mounted volumes from dedicated secret stores rather than baked into images.
- Resource Limits: Enforcing CPU and memory requests and limits to prevent noisy-neighbor workloads or memory leaks from destabilizing entire nodes.
- Network Policies: Defining strict ingress and egress rules at the pod and namespace level to limit unexpected lateral movement within the cluster.
- Kubernetes Audit Logs: Analyzing control plane logs to monitor API server requests, RBAC role bindings, pod exec commands, and service account creations.
Correlating telemetry across application logs, container runtime sensors, and Kubernetes control plane logs gives responders a complete view of workload behavior across the entire orchestration layer.
Cloud Security and Incident Response
Operating in cloud environments requires incident-response workflows tailored to dynamic, multi-tenant, and API-driven infrastructure.
Critical cloud-specific considerations include:
- Identity and Access Management (IAM): Continuous monitoring of IAM role assumptions, permission boundary adjustments, and temporary credential usage.
- Cloud Control-Plane Audit Logs: Centralized ingestion of cloud activity records (e.g., AWS CloudTrail, Azure Activity Log, GCP Cloud Audit) to track every infrastructure API call.
- Dynamic Network Controls: Using software-defined security groups, network access control lists (NACLs), and virtual private cloud (VPC) flow logs to monitor and restrict traffic.
- Cloud Storage Permissions: Monitoring object storage bucket policies and access logs to prevent misconfigurations and unauthorized public exposure.
- Compute Instance Management: Utilizing cloud-native APIs to rapidly isolate instances, create disk snapshots, and attach forensic analysis volumes.
- Managed Cloud Services: Understanding the shared responsibility model across managed databases, serverless functions, and hosted orchestration platforms.
- Cloud Secrets Management: Managing access to cloud key management services (KMS) and rotating exposed encryption keys programmatically.
- Continuous Cloud Asset Inventory: Maintaining real-time visibility into all deployed cloud resources across regions and accounts.
Cloud incident response requires unified visibility into both control-plane API actions and data-plane infrastructure activities.
Identity and Access Management During Incidents
Identity is the primary security perimeter in modern cloud and DevSecOps environments. Investigating security events and operational failures frequently centers on understanding which human identity, service account, or automated role initiated specific actions.
Key identity-centric incident response considerations include:
- Authentication Analysis: Reviewing multi-factor authentication logs, sign-in locations, user-agent strings, and session duration patterns during investigations.
- Authorization Verification: Determining whether an account possessed appropriate permissions for the operations it executed or whether privilege escalation occurred.
- Privileged Access Auditing: Tracking just-in-time access grants and administrative sessions using temporary credentials.
- Machine and Service Identities: Auditing service accounts, CI/CD runner tokens, and workload identities interacting with databases, APIs, and cloud resources.
- Rapid Credential Invalidation: Establishing automated procedures to revoke active sessions, invalidate API tokens, and force password resets across affected accounts.
- Access Boundary Reviews: Periodically auditing IAM roles to prune unused permissions and enforce the principle of least privilege.
Clear identity visibility enables responders to rapidly reconstruct access chains and determine the exact scope of affected services during an incident.
DevSecOps and Incident Containment
Containment is the phase of incident response focused on limiting the blast radius of a failure or security event while investigative and diagnostic work continues.
Defensive containment strategies in a DevSecOps ecosystem include:
- Restricting Access: Temporarily revoking active user sessions, API tokens, or SSH keys associated with affected services.
- Workload Isolation: Modifying security groups or network policies to place an anomalous virtual machine or pod into an isolated quarantine network.
- Disabling Compromised Identities: Suspending affected IAM roles or service accounts via automated scripts or administrative consoles.
- Applying Temporary Network Controls: Blocking anomalous IP addresses or restricting inbound traffic to vulnerable endpoints at the API gateway or Web Application Firewall (WAF) layer.
- Rate Limiting Services: Applying traffic throttling to prevent cascading failures across downstream microservices during denial-of-service conditions.
- Traffic Rerouting: Directing production traffic away from degraded pods or instances using load balancer health checks and canary deployment rules.
Containment decisions must be carefully coordinated, documented, and approved to balance threat mitigation with the need to maintain essential business services.
Recovery and Resilience
Recovery is the process of safely restoring systems to normal production operations after an issue has been contained and eradicated. DevSecOps practices prioritize building inherently resilient architectures that recover quickly through automation.
Incident → Containment → Clean Environment → Validated Build → Deployment → Monitoring → Recovery Confirmation
Core DevSecOps recovery mechanisms include:
- Immutable Build Artifacts: Deploying cryptographically signed, pre-scanned binaries and container images rather than applying ad-hoc manual patches directly onto live servers.
- Infrastructure as Code Rebuilds: Spinning up fresh compute nodes, networks, and clusters from validated declarative code templates to guarantee clean baseline environments.
- Automated Rollback Pipelines: Triggering one-click or automated rollbacks to known-good application versions when post-deployment health metrics degrade.
- Verified Backup Restorations: Restoring data stores from verified, point-in-time backups that have undergone automated integrity checks.
- Progressive Traffic Ramping: Slowly routing user traffic back to restored workloads using canary releases to verify system stability under real-world load.
- Continuous Post-Recovery Telemetry: Intensively monitoring application logs, error rates, and system metrics during the initial hours following recovery to confirm stability.
Recovery mechanisms must be systematically tested in non-production environments to ensure they execute smoothly when a real production incident occurs.
Post-Incident Learning in DevSecOps
The incident-response process does not conclude when production traffic stabilizes. Post-incident learning transforms operational disruptions into permanent engineering improvements that harden the entire delivery ecosystem.
Incident → Review → Learning → Improvement → New Control → Future Feedback
Key elements of an effective post-incident review include:
- Timeline Reconstruction: Building an accurate, chronological sequence of events from the initial change or trigger through detection, triage, containment, and recovery.
- Root-Cause Analysis: Identifying the underlying technical flaws, process gaps, or environmental conditions that allowed the issue to occur.
- Contributing Factor Review: Examining secondary factors that prolonged the incident, such as unclear alerts, missing logs, or incomplete documentation.
- Security Control Assessment: Evaluating why existing automated pipeline tests, SAST rules, or runtime monitors failed to prevent or catch the issue earlier.
- Response Process Evaluation: Reviewing how smoothly on-call handoffs, team communication, and escalation workflows operated during the event.
- Corrective Action Tracking: Converting post-incident action items into prioritized Jira/GitLab engineering tickets with assigned owners and deadlines.
- Blameless Culture: Fostering an engineering environment where incidents are viewed as systemic learning opportunities rather than occasions to assign individual blame.
By updating automated tests, alert rules, and runbooks after every post-incident review, organizations build long-term operational resilience.
How DevSecOps Improves Collaboration During Incidents
Major incidents require coordinated action across multiple engineering disciplines. DevSecOps breaks down organizational silos, creating a unified operational environment where security, development, operations, and platform teams collaborate effectively.
DevSecOps connects diverse organizational stakeholders:
- Development Teams: Provide immediate context regarding recent code changes, feature logic, and application architecture.
- Operations and Platform Teams: Manage infrastructure state, deployment pipelines, network configurations, and resource provisioning.
- Site Reliability Engineers (SREs): Focus on overall system reliability, error budgets, service level objectives (SLOs), and traffic routing.
- Security Engineers: Analyze threat patterns, validate compliance, direct containment strategies, and assess organizational risk.
- Incident Commanders and Responders: Facilitate communication, manage escalation channels, and coordinate technical workflows.
- Technology Leadership: Receive structured, transparent status updates to coordinate business, legal, and customer communications.
Cross-functional collaboration is reinforced through shared telemetry dashboards, standardized operational vocabulary, centralized chatops channels, and unified runbooks. Shared context reduces unnecessary handoffs and speeds up consensus during high-pressure troubleshooting.
Common DevSecOps Incident Response Challenges
Implementing an integrated DevSecOps incident-response model comes with common operational challenges that organizations must recognize and address.
| Challenge | Real-World Example | Recommended Improvement |
| Alert Noise | Responders receive hundreds of low-priority alarms daily, masking critical warnings. | Consolidate alerts, establish dynamic baselines, and tune alert rules regularly. |
| Missing Logs | An application fails, but diagnostic logs lack transaction IDs and client context. | Implement standardized JSON logging schemas and distributed tracing across all services. |
| Unclear Ownership | Responders spend hours determining which engineering team owns a failing microservice. | Maintain an active service catalog with metadata tagging and explicit team assignments. |
| Manual Recovery | Engineers spend hours manually rebuilding and configuring virtual machines via SSH. | Codify all infrastructure provisioning using declarative Infrastructure as Code. |
| Poor Asset Visibility | Responders are unaware of unmanaged cloud resources and shadow IT infrastructure. | Implement continuous cloud asset discovery and automated resource inventory tools. |
| Incomplete Runbooks | On-call engineers follow outdated wiki pages that describe retired system architectures. | Version-control runbooks in code repositories and review them during architecture updates. |
| Weak Access Controls | Shared administrative accounts obscure who initiated critical system modifications. | Enforce individual federated IAM identities, temporary credentials, and least privilege. |
| Slow Vulnerability Fixes | Critical CVEs remain unpatched in production for months due to manual release processes. | Automate dependency scanning and streamline release pipelines for rapid hotfix deployment. |
| Poor Communication | Incident updates are scattered across private chats and uncoordinated email threads. | Establish dedicated, automated incident channels and designate a single incident commander. |
Common Mistakes Organizations Make
Organizations transitioning to DevSecOps often encounter operational pitfalls that undermine their incident-response capabilities:
- Treating DevSecOps as Only a Pipeline Scanning Tool: Relying solely on automated SAST/SCA scanners without cultivating runtime observability, incident-response workflows, or cross-team collaboration.
- Waiting Until Production to Address Security: Postponing security reviews and compliance validations until code reaches staging or production environments.
- Collecting Logs Without Analyzing Them: Ingesting terabytes of raw logs into storage systems without building structured indexes, correlation rules, or dashboard visualizations.
- Automating Response Actions Without Safeguards: Implementing aggressive automated remediation scripts without sufficient testing, boundary checks, or human approval workflows.
- Ignoring Incident Simulations: Failing to run regular tabletop exercises, game days, or simulated outages to validate team readiness.
- Neglecting Recovery Testing: Assuming backup snapshots and IaC templates will work during a disaster without regularly running automated restoration tests.
- Failing to Maintain Asset Inventories: Allowing untracked cloud instances, abandoned storage buckets, and deprecated services to run unmonitored.
- Ignoring Identity Security: Overlooking IAM hygiene, service account permissions, and API token rotation while focusing exclusively on network firewalls.
- Creating Excessive Alerting: Configuring low-threshold alerts for every minor metric fluctuation, leading directly to alert fatigue and delayed responses.
- Blaming Individuals After Outages: Punishing engineers for human errors rather than addressing the systemic tooling and process gaps that allowed the failure to occur.
Addressing these common mistakes requires continuous process evaluation, strong engineering discipline, and a leadership commitment to systemic, blameless learning.
How to Measure DevSecOps Incident Response
Tracking clear, objective metrics helps engineering leaders evaluate the effectiveness of their incident-response capabilities and pinpoint areas needing optimization.
| Metric | Focus Area | Operational Purpose |
| Mean Time to Detect (MTTD) | Detection Speed | Measures how quickly monitoring and observability systems identify an anomaly. |
| Mean Time to Acknowledge (MTTA) | Response Readiness | Measures the time elapsed between an alert firing and an on-call engineer beginning triage. |
| Mean Time to Contain (MTTC) | Containment Efficiency | Measures how long responders take to isolate an issue and stop the blast radius from growing. |
| Mean Time to Recover (MTTR) | Restoration Speed | Measures the total duration required to restore full, validated production functionality. |
| Incident Recurrence Rate | Long-Term Prevention | Tracks how frequently identical or related failures occur across similar workloads over time. |
| Remediation Time (MTTRem) | Vulnerability Management | Measures how quickly teams develop, test, and deploy fixes for discovered vulnerabilities. |
| Alert False-Positive Rate | Alert Quality | Measures the proportion of non-actionable alarms, indicating the health and precision of alert rules. |
| Detection Coverage | Telemetry Completeness | Evaluates the percentage of production infrastructure and applications monitored by telemetry. |
| Recovery Test Success Rate | Disaster Preparedness | Measures the success rate of scheduled automated backup restorations and IaC rebuilds. |
| Action Completion Rate | Continuous Improvement | Tracks the percentage of post-incident action items completed within agreed SLAs. |
Metrics should be used to improve technical systems, automate manual steps, and refine operational processes rather than evaluate or punish individual engineers.
Real-World DevSecOps Incident Response Example
To understand how DevSecOps practices operate during a live production event, consider this scenario involving an unexpected database latency spike and credential anomaly in a cloud-native microservices application.
Security & Performance Signal
    ↓
Alert Generated & Paged to On-Call
    ↓
Incident Created & Channel Provisioned
    ↓
Joint Security + SRE Investigation
    ↓
Affected Microservice & IAM Role Identified
    ↓
Defensive Containment Applied
    ↓
Automated Evidence Collection Executed
    ↓
Root-Cause Analysis (Vulnerable Dependency Identified)
    ↓
Automated Clean Rebuild & Deployment
    ↓
Production Validation & Monitoring
    ↓
Post-Incident Improvements Implemented
Scenario Walkthrough
- Signal & Alert: Runtime observability agents detect a 300% surge in database read latency paired with an unexpected spike in outbound API calls from an order-processing pod. An automated high-priority alert is generated and dispatched to the on-call SRE and security engineer.
- Triage & Channel Provisioning: The monitoring platform automatically spins up a dedicated Slack incident channel, logs the alert metadata, and attaches links to relevant distributed tracing dashboards.
- Investigation: Using centralized distributed tracing, the SRE identifies the exact pod generating the anomalous queries. The security engineer reviews correlated cloud audit logs and discovers that the pod’s service account was used to query unauthorized database tables.
- Containment: Responders apply a predefined network policy that restricts the affected pod’s egress traffic to essential internal services while isolating its network access to the database. The active session tokens for the service account are programmatically revoked.
- Evidence Collection: An automated script captures memory diagnostics, running process trees, and network connection states from the isolated pod, archiving the evidence into secure, immutable storage for later analysis.
- Root Cause Identification: The team traces the running container image back to its CI/CD pipeline build metadata and Software Bill of Materials. They discover a vulnerable third-party XML parsing library that permitted remote execution via a malformed API request.
- Eradication & Clean Rebuild: Developers update the dependency version in Git. The CI/CD pipeline runs SAST, SCA, and container scans, builds an updated immutable image, signs it cryptographically, and validates it against test suites.
- Deployment & Recovery: The updated image is rolled out to production using a canary deployment strategy. Responders monitor error rates and latency metrics as traffic gradually shifts to the new pods.
- Validation: Telemetry confirms database latency has returned to normal baselines and no anomalous API calls are occurring. The incident is declared resolved.
- Post-Incident Improvements: During the blameless review, the team adds an automated pipeline rule to block deprecated parsing libraries, introduces stricter IAM permission boundaries for microservice accounts, and refines distributed tracing alert thresholds.
Practical DevSecOps Incident Response Framework
Organizations can adopt a structured ten-step framework to guide their DevSecOps incident-response practices:
1. Prepare → 2. Detect → 3. Validate → 4. Investigate → 5. Contain → 6. Eradicate → 7. Recover → 8. Monitor → 9. Learn → 10. Improve
- Prepare: Establish living runbooks, configure centralized telemetry, implement Infrastructure as Code, enforce least privilege, and conduct regular incident simulations.
- Detect: Process runtime metrics, logs, traces, and security events through automated detection engines to identify anomalies quickly.
- Validate: Confirm the authenticity and severity of alerts to eliminate false positives and establish an appropriate incident classification level.
- Investigate: Correlate distributed traces, centralized logs, and deployment histories to determine the blast radius and root cause of the disruption.
- Contain: Apply scoped, defensive containment controls—such as isolating pods, revoking tokens, or rerouting traffic—to prevent further operational impact.
- Eradicate: Remove the root cause by applying code fixes, updating dependencies, or correcting infrastructure misconfigurations in source repositories.
- Recover: Deploy verified, immutable build artifacts and reprovision infrastructure using automated CI/CD pipelines and declarative IaC templates.
- Monitor: Closely track real-time telemetry across application and infrastructure layers to confirm system health and performance stability.
- Learn: Hold a blameless post-incident review to reconstruct the event timeline, analyze contributing factors, and evaluate the response process.
- Improve: Convert post-incident action items into automated pipeline checks, updated alert rules, revised runbooks, and architectural enhancements.
DevSecOps Incident Response Checklist
Use this operational checklist to evaluate and improve your organization’s DevSecOps incident-response readiness:
- Define explicit incident-response roles, responsibilities, and on-call rotations.
- Maintain automated escalation paths and dedicated incident communication channels.
- Maintain a real-time asset inventory across all cloud accounts, clusters, and services.
- Enforce structured, centralized logging with synchronized UTC timestamps across all workloads.
- Configure continuous observability across logs, metrics, distributed traces, and events.
- Establish unambiguous service ownership metadata within shared service catalogs.
- Create and version-control modular incident runbooks alongside application code.
- Integrate automated SAST, SCA, secret scanning, and IaC linting into CI/CD pipelines.
- Maintain continuous vulnerability tracking and risk-based remediation workflows.
- Enforce the principle of least privilege across cloud IAM, container clusters, and pipelines.
- Regularly test automated backup and disaster recovery restoration procedures.
- Validate that Infrastructure as Code templates can cleanly rebuild environments from scratch.
- Practice regular incident simulations, tabletop exercises, and chaos experiments.
- Document and test defensive containment procedures for rapid workload isolation.
- Establish automated evidence collection procedures that preserve forensic state safely.
- Conduct blameless post-incident reviews following all significant operational events.
- Track post-incident corrective engineering actions to completion under defined SLAs.
- Continuously tune alerting thresholds to minimize noise and eliminate false positives.
- Validate and scope automated response scripts to prevent unintended system disruptions.
- Maintain mandatory human oversight and approval checkpoints for high-impact response actions.
DevSecOps Incident Response Learning Roadmap
Developing expertise in DevSecOps incident response requires building a progressive foundation across software delivery, infrastructure, security analysis, and operational resilience.
Security Fundamentals
    ↓
DevOps Fundamentals
    ↓
CI/CD Security
    ↓
Cloud Security
    ↓
Infrastructure as Code
    ↓
Observability & Telemetry
    ↓
Security Monitoring
    ↓
Incident Response Methodologies
    ↓
Defensive Automation
    ↓
Threat Detection & Analysis
    ↓
Post-Incident Engineering
    ↓
Continuous Security Improvement
- Security Fundamentals: Core networking, cryptographic protocols, access control models, vulnerability classifications, and secure software development principles.
- DevOps Fundamentals: Linux administration, containerization (Docker), orchestration (Kubernetes), Git workflows, and modern microservices architecture.
- CI/CD Security: Building secure automated delivery pipelines, implementing static and dynamic security scanners, artifact signing, and software supply chain security.
- Cloud Security: Mastering cloud identity and access management (IAM), software-defined networking, security groups, audit logging, and cloud service provider architectures.
- Infrastructure as Code: Declarative provisioning with Terraform, OpenTofu, Ansible, and Helm, focusing on version control, linting, and policy-as-code enforcement.
- Observability & Telemetry: Configuring metrics collection, structured logging, distributed tracing (OpenTelemetry), and telemetry correlation across complex distributed systems.
- Security Monitoring: Designing high-fidelity alert rules, building operational dashboards, eliminating alert fatigue, and establishing proactive baseline monitoring.
- Incident Response Methodologies: Triage frameworks, containment strategies, forensic evidence preservation, and operational communication protocols.
- Defensive Automation: Writing safe, scoped automation scripts for ticket generation, diagnostic snapshotting, host isolation, and automated rollback workflows.
- Threat Detection & Analysis: Log parsing, correlation techniques, anomaly detection, and understanding real-world operational failure modes.
- Post-Incident Engineering: Facilitating blameless post-incident reviews, reconstructing incident timelines, and conducting deep root-cause analyses.
- Continuous Security Improvement: Translating operational learnings into automated pipeline guardrails, updated tests, and resilient architectural designs.
Career Value of DevSecOps Incident Response Skills
As enterprises continue to migrate complex workloads to distributed cloud and container environments, professionals who understand both software delivery pipelines and security response operations are in exceptionally high demand.
| Role | Core Value of DevSecOps Incident Response Skills |
| DevSecOps Engineer | Bridges security controls and delivery pipelines to build automated defense and rapid remediation systems. |
| Security Engineer | Leverages CI/CD, IaC, and centralized telemetry to investigate threats faster and enforce programmatic guardrails. |
| DevOps Engineer | Integrates automated recovery, rollback, and security validation mechanisms into core deployment workflows. |
| Site Reliability Engineer (SRE) | Enhances service availability and MTTR by correlating security signals with system performance telemetry. |
| Cloud Security Engineer | Protects dynamic multi-cloud environments through automated IAM controls, audit logging, and IaC hardening. |
| Incident Responder | Accelerates triage and containment using pipeline metadata, immutable build artifacts, and deep cloud visibility. |
| Platform Engineer | Designs resilient internal developer platforms with built-in observability, security gates, and self-healing features. |
| Security Consultant | Advises organizations on transitioning from slow, reactive security reviews to continuous, automated DevSecOps workflows. |
Professionals who master both delivery automation and security response are uniquely equipped to design, operate, and defend resilient software systems at enterprise scale.
Frequently Asked Questions
What is incident response in DevSecOps?
Incident response in DevSecOps is a collaborative, continuous methodology where security, development, and operations teams use automated testing, shared telemetry, and reproducible infrastructure to prepare for, detect, investigate, contain, and recover from operational and security incidents.
How does DevSecOps improve incident response?
DevSecOps improves incident response by breaking down team silos, providing end-to-end observability, embedding automated security checks into CI/CD pipelines, enabling repeatable environment rebuilds via Infrastructure as Code, and turning post-incident learnings into automated guardrails.
Why is security feedback important before production?
Catching vulnerabilities, misconfigurations, and code flaws during early development and build stages prevents defects from ever reaching production. This significantly reduces the attack surface and minimizes runtime operational disruptions.
How does CI/CD support incident response?
CI/CD pipelines provide complete audit trails linking production artifacts back to specific source commits, enforce automated security testing gates, and enable engineering teams to rapidly build, test, and deploy verified patches or rollbacks during an active incident.
How does observability help detect security incidents?
Observability combines logs, metrics, distributed traces, and system events, enabling responders to correlate unusual application behavior (such as unexpected latency or memory pressure) with underlying security events (such as unauthorized API queries or failed authentication attempts).
Why are centralized logs important during investigations?
Centralized logs consolidate application, infrastructure, authentication, and cloud audit logs into a unified, searchable location with consistent UTC timestamps. This allows responders to reconstruct accurate incident timelines and evaluate blast radiuses without manually accessing individual nodes.
How does Infrastructure as Code support recovery?
Infrastructure as Code (IaC) allows teams to redeploy clean, uncompromised, and identically configured environments automatically from version-controlled configuration files. This eliminates error-prone manual provisioning and accelerates system recovery during major outages.
How can automated incident response help DevSecOps teams?
Automated incident response can instantly perform safe, low-risk defensive tasks—such as creating incident tickets, collecting diagnostic memory dumps, isolating compromised pods, and notifying on-call engineers—drastically reducing containment and investigation time.
Should incident response be fully automated?
No. While automated workflows should handle repetitive, well-scoped tasks like evidence gathering and initial quarantine, high-impact decisions (such as terminating core databases or shutting down business-critical services) should always require human evaluation, authorization, and oversight.
How does cloud security affect incident response?
Cloud environments are API-driven and identity-centric, requiring responders to have real-time visibility into cloud control-plane audit logs, IAM role assumptions, software-defined network policies, and dynamic resource inventories alongside traditional server logs.
Why are post-incident reviews important in DevSecOps?
Post-incident reviews allow organizations to conduct blameless analyses of operational disruptions, identify contributing technical and procedural factors, and turn lessons learned into new automated pipeline tests, alert rules, and architectural improvements to prevent recurrence.
Which metrics can be used to measure incident-response effectiveness?
Key metrics include Mean Time to Detect (MTTD), Mean Time to Acknowledge (MTTA), Mean Time to Contain (MTTC), Mean Time to Recover (MTTR), Incident Recurrence Rate, Vulnerability Remediation Time, Alert False-Positive Rate, and Recovery Test Success Rate.
Final Thoughts
DevSecOps fundamentally transforms incident response by shifting organizations away from reactive, manual firefighting and toward a culture of continuous preparedness, deep visibility, and automated resilience. By embedding security validation into the software delivery pipeline and codifying infrastructure management, organizations ensure that their systems are built, deployed, and monitored with operational integrity from the outset. True incident response effectiveness is not measured solely by how quickly responders react to a critical alert. It depends on the structural foundations established long before an anomaly appears: comprehensive telemetry, actionable runbooks, shared cross-team ownership, immutable build artifacts, and tested recovery automation. When these elements operate in harmony, engineering teams can investigate complex issues with clarity, contain disruptions safely, and restore healthy services with minimal downtime. DevSecOps does not promise the total elimination of operational failures or security events in complex distributed systems. Instead, it provides engineering teams with the technical capabilities, cultural alignment, and continuous feedback loops needed to detect anomalies early, respond decisively, recover reliably, and systematically learn from every event.






Leave a Reply
You must be logged in to post a comment.