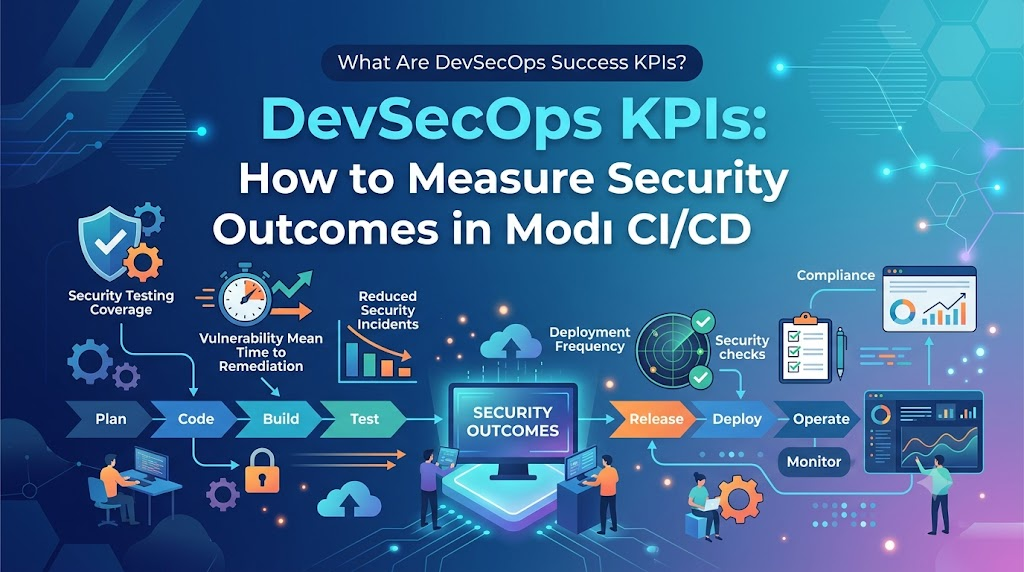
Integrating security into modern software delivery requires much more than purchasing commercial scanners or dropping automated checks into a deployment script. Many engineering teams install dozens of security tools across their pipelines, only to end up overwhelmed by noisy dashboards, developer friction, and backlogs of unresolved findings. Adding security tools to an automated workflow demonstrates effort, but it does not prove that production systems are genuinely safer or that software delivery remains dependable.
DevSecOps success KPIs (Key Performance Indicators) are measurable values that show whether an organization’s security practices actually identify meaningful risks, enable timely remediation, protect running workloads, and support predictable delivery cycles. Rather than treating security as an isolated auditing phase or a final gate before deployment, practical measurement links security outcomes directly to engineering workflows.
This comprehensive guide breaks down what DevSecOps KPIs are, why traditional activity metrics fall short, which key performance indicators matter most, how to calculate them with precise formulas, and how engineering teams can use these metrics to drive sustainable, evidence-based improvements across the entire software development lifecycle (SDLC).
What Is DevSecOps?
DevSecOps stands for Development, Security, and Operations. It is an engineering culture, set of practices, and architectural approach designed to unify software creation, infrastructure operations, and system protection into a continuous, collaborative delivery cycle.
Historically, software development followed siloed handoffs: software engineers wrote features, operations deployed infrastructure, and an application security team conducted manual reviews or penetration tests right before a production release. This traditional model created an adversarial bottleneck. Security teams were forced to either halt deployments late in the cycle—driving up engineering costs and delaying delivery—or let unvetted code proceed to production to meet commercial deadlines.
Traditional Delivery:
[ Development ] ──> [ Operations ] ──> [ Security Gate (Audit/Block) ] ──> [ Production ]

Shift-Left DevSecOps:
[ Continuous Security Testing & Automated Guardrails Built-in ]
[ Plan ] ──> [ Code ] ──> [ Build ] ──> [ Test ] ──> [ Deploy ] ──> [ Operate & Monitor ]
      ▲                                                                     │
      └──────────────── Continuous Feedback Loop ───────────────────────────┘
DevSecOps transforms this model through several core principles:
- Shift-Left Security: Identifying design flaws, exposed secrets, and vulnerable libraries early in the local development and code-review phases, where issues are simplest and least costly to fix.
- Security Automation in CI/CD: Running automated static checks, software dependency scans, and policy-as-code validations directly within Continuous Integration and Continuous Delivery (CI/CD) pipelines.
- Shared Ownership and Collaboration: Breaking down organizational silos so developers treat code security as an inherent element of software quality, while security teams focus on engineering guardrails, providing developer tooling, and triage support.
- Continuous Monitoring and Feedback: Maintaining real-time runtime monitoring, telemetry, and threat detection in production, feeding operational findings back to development teams to prevent recurrence.
DevSecOps does not replace DevOps. Instead, it completes DevOps by ensuring that rapid releases do not trade away system resilience, user privacy, or regulatory compliance.
What Are DevSecOps Success KPIs?
In software delivery, a metric is any raw, quantifiable measurement (for example, the number of scans run this week or the count of alerts triggered). A Key Risk Indicator (KRI) is an operational metric that signals rising exposure or an approaching threshold of unacceptable business risk.
A Key Performance Indicator (KPI) is a selected metric evaluated against strategic targets to determine how effectively a team, system, or organization achieves its core operational goals.
In a DevSecOps context, success KPIs measure how effectively security practices integrate with software engineering to reduce technical risk, maintain delivery velocity, and ensure resilient operations. Meaningful DevSecOps KPIs help organizations:
- Track security risk trends across releases over time.
- Evaluate vulnerability detection speed and actual remediation throughput.
- Measure the real-world effectiveness and friction of automated pipeline checks.
- Spot systemic bottlenecks in engineering and deployment workflows.
- Verify compliance with regulatory standards and internal security baselines.
- Gauge incident detection, containment, and recovery efficiency.
- Balance release frequency with rigorous code protection.
A fundamental rule of DevSecOps performance measurement is that activity does not equal outcome. Generating 5,000 automated scan alerts or running 200 pipeline checks every day does not prove that an application is secure. If those 5,000 alerts represent duplicate findings or ignored false positives that developers routinely bypass, risk remains high. DevSecOps KPIs focus on actionable outcomes: how quickly real flaws are neutralized, how rarely vulnerabilities escape to production, and how reliably delivery pipelines move code forward securely.
Why Are DevSecOps KPIs Important?
Without objective, repeatable metrics, organizations manage security through intuition, reactive fire drills, or vendor marketing promises. Clear DevSecOps metrics provide the operational visibility needed to govern engineering quality systematically.
The practical value of tracking DevSecOps performance indicators includes:
- Earlier Identification of Flaws: Catching security flaws during compilation or automated integration testing reduces technical debt before artifacts reach staging environments.
- Risk-Based Prioritization: Helping developers focus their limited bandwidth on genuine, reachable vulnerabilities rather than treating low-priority informational alerts with the same urgency as exploitable remote code execution risks.
- Accountability and Clear Ownership: Establishing clear lines of responsibility for resolving code flaws, managing dependencies, and maintaining secure cloud configurations.
- Actionable Pipeline Guardrails: Revealing whether security gates actually stop critical flaws or merely introduce build delays that prompt developers to request blanket exceptions.
- Supply-Chain Visibility: Measuring how effectively teams inspect open-source libraries, base container images, and software bills of materials (SBOMs).
- Informed Trade-Off Decisions: Giving engineering leads and technical executives the data needed to make sound decisions when balancing feature delivery deadlines against acceptable risk thresholds.
How Missing Metrics Obscure Security Problems
Consider a mid-sized engineering organization that reports run counts for Static Application Security Testing (SAST) to executive leadership. The dashboard proudly shows that the team ran 10,000 security scans across all branches this quarter.
Because the team does not track remediation throughput, backlog aging, or vulnerability escape rates, the metric hides three severe structural failures:
- Ignored Findings: Over 80% of identified high-severity findings remain unassigned because developers lack an established triage workflow.
- Alert Fatigue: A high false-positive rate has trained developers to dismiss warnings automatically.
- Escapes to Production: Unpatched critical dependencies continue to deploy to live customer environments because scanning runs purely in an advisory, non-blocking mode on feature branches without policy enforcement.
Tracking scan activity created a false sense of security, whereas outcome-oriented KPIs would have immediately flagged an expanding backlog and failing remediation workflows.
The Most Important DevSecOps Success KPIs
Evaluating security across the modern SDLC requires a balanced scorecard that spans vulnerability management, pipeline automation, operational response, compliance, and delivery performance.
| KPI or Metric | What It Measures | Why It Matters | What to Investigate When Results Deteriorate |
| Mean Time to Remediate (MTTR) | Average calendar time required to resolve and verify an identified vulnerability. | Verifies how quickly the team neutralizes known exposures before attackers can exploit them. | Triage bottlenecks, developer workload, poor documentation, unclear patch ownership, complex release processes. |
| Critical & High Backlog | Total active, unmitigated critical- and high-severity vulnerabilities across repositories. | Quantifies accumulated technical security debt and overall exploitable attack surface. | Scanner policy changes, inadequate remediation capacity, influx of vulnerable third-party dependencies. |
| Remediation SLA Compliance | Percentage of eligible vulnerabilities remediated within policy deadlines. | Ensures teams maintain predictable remediation hygiene aligned with defined business risk tolerance. | Inadequate staffing, competing roadmap priorities, unrealistic SLA thresholds, alert fatigue. |
| Vulnerability Escape Rate | Proportion of vulnerabilities discovered after release relative to all findings in that scope. | Validates the effectiveness and coverage of automated pre-release security testing checks. | Gaps in pipeline tooling, bypassed CI/CD security gates, test environment differences, outdated scanning rules. |
| Security Testing Coverage | Percentage of active codebases, builds, or pipelines executing required security checks. | Guarantees that blind spots do not emerge as the microservice or repository footprint expands. | Newly provisioned repositories missing template hooks, legacy applications, misconfigured build definitions. |
| Security Gate Pass Rate | Percentage of pipeline runs that meet defined security criteria without manual overrides. | Highlights whether automated policies serve as practical quality guardrails or disruptive bottlenecks. | Overly aggressive blocking rules, outdated baseline definitions, high false-positive rates, poor local tooling. |
| Mean Time to Detect (MTTD) | Average time elapsed between an incident’s start and its detection by monitoring systems. | Measures the visibility, fidelity, and responsiveness of runtime security telemetry and alerting. | Gaps in audit logging, alert noise, misconfigured SIEM rules, inadequate runtime monitoring across environments. |
| Mean Time to Contain & Recover | Average time required to isolate an active threat and return systems to healthy baseline operations. | Gauges operational resilience, response automation, and disaster recovery effectiveness. | Lack of runbooks, slow access provisioning for responders, brittle rollback mechanisms, manual deployment steps. |
| False-Positive Rate | Proportion of investigated security scanner findings confirmed as non-actionable or invalid. | High rates cause developer alert fatigue, erode trust, and slow delivery cadence. | Poor tool tuning, generic out-of-the-box rule sets, context-unaware scanning tools, missing suppression rules. |
| Security Policy Compliance | Proportion of cloud, container, and infrastructure controls that satisfy codified policies. | Validates governance, regulatory posture, and infrastructure baseline hygiene continuously. | Configuration drift, unvetted infrastructure changes, unmanaged cloud resources, unapproved IAM exceptions. |
| Security Debt & Recurrence | Volume of long-standing unresolved issues and recurring security anti-patterns across builds. | Identifies deep systemic weaknesses in coding standards, library management, or architecture. | Copy-paste code practices, inadequate developer training, lack of centralized base image management. |
| Supply-Chain Security Coverage | Proportion of released artifacts with complete dependency scans, valid SBOMs, and provenance. | Protects against compromised third-party packages, license exposure, and malicious upstream updates. | Legacy build pipelines, unpinned package dependencies, missing container registry scanning configurations. |
| Security Incident Rate & Impact | Number, severity distribution, and operational blast radius of confirmed production incidents. | Direct measure of runtime risk realization and control failure in real-world environments. | Ineffective preventative controls, architectural design flaws, newly disclosed zero-day vulnerabilities. |
| DORA Delivery Metrics | Deployment Frequency, Change Lead Time, Change Failure Rate, Failed Deployment Recovery Time. | Ensures that tightening security controls does not compromise delivery speed or operational stability. | Overly burdensome manual security reviews, fragile automated gates, unstable deployment automation. |
A. Mean Time to Remediate Vulnerabilities (MTTR)
Mean Time to Remediate (MTTR) measures the average duration from when a vulnerability is first identified and verified to the point where an engineering team deploys and confirms a fix.
Granular Segmentation
Reporting an aggregate MTTR across all vulnerability classes produces misleading results. A team might fix 100 trivial code style issues in three hours, skewing the average downward while a critical remote code execution vulnerability remains unpatched in production for 90 days. MTTR must be segmented by:
- Severity Level: Separate metrics for Critical, High, Medium, and Low (using Common Vulnerability Scoring System or CVSS base metrics).
- Exploitability: Prioritizing vulnerabilities with active public exploits (such as those listed in the CISA Known Exploited Vulnerabilities catalog).
- Asset Exposure: Differentiating between internet-facing production services and isolated internal developer environments.
- Business Impact: Weighting systems handling sensitive financial or personal data higher than internal documentation tools.
Clarification: DevSecOps MTTR for vulnerabilities measures the lifespan of a security defect. It should not be confused with incident MTTR (Mean Time to Recover), which measures the time required to restore a down or degraded service to operational health.
B. Critical and High-Severity Vulnerability Backlog
This metric tracks the total volume of unresolved critical- and high-severity security issues present across all active repositories and cloud environments at any given moment.
Managing a backlog requires tracking:
- Vulnerability Aging: How many days each finding has remained unresolved.
- Reachable Attack Surface: Determining whether a vulnerable library method is actually called by the application’s runtime execution path.
- Direct Ownership: Ensuring every open flaw maps to an active engineering team rather than an unassigned service.
A declining backlog is an indicator of progress only when scanning coverage and discovery quality remain constant or improve. If a team turns off sensitive scanning rules or stops scanning older repositories, the backlog will drop sharply on paper while underlying technical debt quietly expands.
C. Vulnerability Remediation SLA Compliance
Service Level Agreement (SLA) compliance measures the percentage of security findings resolved within predefined, policy-mandated timeframes.
Organizations typically establish tiered remediation deadlines:
- Critical (CVSS 9.0–10.0 or actively exploited): 24 to 72 hours.
- High (CVSS 7.0–8.9): 7 to 14 days.
- Medium (CVSS 4.0–6.9): 30 to 60 days.
- Low (CVSS 0.1–3.9): 90 days or scheduled within routine maintenance cycles.
Compliance rates reveal whether development teams treat security findings as urgent quality defects or treat deadlines as optional guidelines.
D. Vulnerability Escape Rate
The Vulnerability Escape Rate identifies flaws that bypassed automated pre-release checks and were only detected after deployment—whether through external bug bounties, customer bug reports, penetration tests, or runtime security scans.
To interpret this metric accurately, teams must define a consistent measurement window (such as a 30-day or 90-day release cycle) and a stable scope (such as a specific microservice or application suite).
A high escape rate demonstrates that automated static analysis, dependency scanning, or integration tests fail to catch real-world attack vectors. Conversely, an escape rate of zero might simply mean the team does not conduct post-release testing or lack an external vulnerability disclosure program.
E. Security Testing Coverage
Security Testing Coverage measures the proportion of active codebases, CI/CD pipelines, container registries, and deployed environments that undergo mandated security analysis.
Comprehensive coverage must span multiple testing disciplines:
- Static Application Security Testing (SAST): Scanning custom source code for common weaknesses like SQL injection, cross-site scripting, and insecure cryptography.
- Software Composition Analysis (SCA): Inspecting open-source libraries and transitive dependencies for known vulnerabilities and licensing risks.
- Secret Detection: Scanning commits and repositories for hardcoded API tokens, passwords, and private certificates.
- Infrastructure as Code (IaC) Scanning: Auditing Terraform, CloudFormation, Helm charts, and Kubernetes manifests for misconfigurations before infrastructure is provisioned.
- Container Image Scanning: Checking base OS layers and installed packages within Docker images for known Common Vulnerabilities and Exposures (CVEs).
- Dynamic Application Security Testing (DAST): Probing running staging endpoints to identify runtime vulnerabilities without access to source code.
High coverage does not guarantee application security. If a tool scans 100% of repositories but runs an outdated, unmaintained rule set, coverage is complete, but risk detection remains inadequate.
F. Security Gate Pass Rate
The Security Gate Pass Rate measures the percentage of automated pipeline runs that satisfy security policy requirements on their first evaluation without triggering build breaks or requiring manual approval overrides.
Security gates enforce defined policies, such as blocking builds that introduce new Critical CVEs with public exploits or hardcoded secrets.
When gate pass rates plunge, teams face release friction, leading developers to seek workarounds. When configuring this metric, engineering teams must define whether re-running a pipeline after a quick commit counts as a distinct failure and establish transparent, auditable criteria for risk-accepted exceptions.
G. Mean Time to Detect Security Incidents (MTTD)
Mean Time to Detect (MTTD) tracks the time elapsed from the moment an attacker initiates an unauthorized action or an intrusion begins until internal monitoring systems, alerting tools, or human operators recognize the event as a confirmed incident.
Unlike vulnerability discovery—which identifies potential weaknesses in static code or systems—MTTD evaluates runtime threat detection. A low MTTD reflects comprehensive audit logging, properly tuned Security Information and Event Management (SIEM) systems, and effective runtime workload monitoring.
H. Mean Time to Contain and Recover From Security Incidents
Once an active threat is detected, teams must measure two critical operational phases:
- Mean Time to Contain (MTTC): The time required to isolate affected nodes, revoke compromised credentials, and halt malicious lateral movement.
- Mean Time to Recover (MTTR-Incident): The time required to patch underlying vulnerabilities, re-image systems from trusted CI/CD artifacts, restore data from clean backups, and return services to normal production operation.
Tracking containment and recovery separately clarifies whether operational delays stem from incident triage confusion or rigid, manual deployment mechanisms.
I. False-Positive Rate of Security Alerts
The False-Positive Rate measures the percentage of security warnings that security analysts or developers review and determine to be non-issues, irrelevant noise, or incorrect detections.
High false-positive rates degrade developer productivity, slow down delivery cadences, and cause alert fatigue. When developers see dozens of irrelevant warnings every sprint, they begin dismissing all alerts, allowing genuine vulnerabilities to slip past unnoticed.
J. Security Policy Compliance Rate
This metric evaluates the proportion of infrastructure assets, cloud accounts, code repositories, and runtime environments that comply with internal baselines and external regulatory frameworks (such as SOC 2, ISO 27001, PCI DSS, or CIS Benchmarks).
Modern DevSecOps teams track compliance continuously through automated Policy-as-Code engines (such as Open Policy Agent or cloud configuration auditors) rather than relying on annual audits.
K. Security Debt and Recurring Vulnerabilities
Security debt represents the compounding technical cost of unresolved vulnerabilities, postponed dependency upgrades, and unmaintained legacy configurations.
Tracking security debt involves measuring:
- The cumulative count of vulnerabilities older than twice their assigned SLA.
- Recurring Vulnerabilities: Flaws that share the exact root cause (such as repeated injection flaws across microservices or repeatedly reintroduced insecure configuration settings).
High recurrence rates signal a training gap or architectural defect that pipeline tools cannot solve on their own.
L. Software Supply-Chain Security Coverage
Modern applications consist overwhelmingly of third-party open-source components and pre-built base images. Software supply-chain security coverage measures the extent to which these external dependencies are verified and governed.
Controls evaluated under this umbrella include:
- Generating verifiable Software Bills of Materials (SBOMs) in formats like CycloneDX or SPDX.
- Enforcing cryptographic signature verification (such as Sigstore/Cosign) on container images before deployment.
- Prohibiting dependencies with unmaintained licenses or known high-severity vulnerabilities from internal artifact registries.
M. Security Incident Rate and Impact
This metric tracks the raw frequency, severity, and business consequences of security events in staging and production.
       Incident Severity Distribution
       ──────────────────────────────
       [Critical]  ■ (1)  - Data Exposure / Core Outage
       [High]      ■■ (2) - Privilege Escalation
       [Medium]    ■■■■■ (5) - Unauthorized Low-Privilege Action
       [Low]       ■■■■■■■■■■■ (11) - Policy Violation / Uncategorized Probe
When evaluating incident rates, remember that improving logging and runtime detection often causes reported incidents to rise initially. This spike does not necessarily mean the environment has become less secure; rather, the team has illuminated blind spots that previously went unnoticed.
N. DORA Delivery Performance Metrics
DevSecOps teams must monitor delivery velocity and operational stability alongside security indicators. The four DORA (DevOps Research and Assessment) metrics provide this baseline:
- Deployment Frequency: How often an organization successfully releases code to production.
- Lead Time for Changes: The time it takes for a commit to make it from code review into production.
- Change Failure Rate: The percentage of deployments that cause a production failure or require immediate remediation (such as rollbacks or emergency patches).
- Failed Deployment Recovery Time: The time required to restore service when a deployment introduces an outage.
Evaluating DORA metrics alongside security KPIs ensures that automated security checks remain efficient. If security gates increase lead times from two hours to two weeks, the DevSecOps integration has failed its primary objective: enabling secure, sustainable velocity.
Security KPI Formulas and Calculation Examples
To prevent ambiguity, organizations should define calculation criteria up front:
- Measurement Period: A calendar month, fiscal quarter, or 30-day rolling window.
- Unit of Measure: Unique vulnerabilities, distinct code repositories, or individual build executions.
- Data Sources: Direct exports from vulnerability managers, CI/CD platforms, or SIEM tools.
- Denominator Rules: Exact definitions of eligible items (for example, excluding archived or read-only code repositories).
- Severity Tiers: Strict adherence to agreed CVSS cutoffs.
- Timestamps: Exact timestamps for finding creation, ticket assignment, code merge, and production verification.
The table below outlines standard formulas for core DevSecOps KPIs:
| Metric Name | Formula | Required Input Variables |
| Mean Time to Remediate (MTTR) | $\frac{\sum (\text{Verification Timestamp} – \text{Detection Timestamp})}{\text{Count of Resolved Findings}}$ | Timestamp of initial detection, timestamp of verified production fix, count of resolved vulnerabilities. |
| Remediation SLA Compliance | $\frac{V_{\text{within}}}{V_{\text{due}}} \times 100$ | $V_{\text{within}}$: vulnerabilities resolved within SLA deadline; $V_{\text{due}}$: total vulnerabilities whose SLA expired during the window. |
| Security Testing Coverage | $\frac{R_{\text{scanned}}}{R_{\text{total}}} \times 100$ | $R_{\text{scanned}}$: active repositories passing all required security scans; $R_{\text{total}}$: total active repositories in scope. |
| Vulnerability Escape Rate | $\frac{V_{\text{post}}}{V_{\text{pre}} + V_{\text{post}}} \times 100$ | $V_{\text{post}}$: vulnerabilities discovered post-release; $V_{\text{pre}}$: vulnerabilities caught by automated pipeline checks pre-release. |
| False-Positive Rate | $\frac{F_{\text{false}}}{F_{\text{total}}} \times 100$ | $F_{\text{false}}$: findings confirmed as invalid by security review; $F_{\text{total}}$: total findings reviewed during the period. |
Worked Calculation Examples
The following examples use hypothetical data to illustrate how these formulas apply in practice. They do not represent universal industry targets or prescriptive benchmarks.
Example 1: Calculating Remediation SLA Compliance
- Context: An engineering group sets an SLA requiring Critical vulnerabilities to be patched within 72 hours and High vulnerabilities within 14 days.
- Hypothetical Monthly Dataset:
- Total Critical and High findings with SLA due dates in the current month: 40
- Findings resolved within their defined time limits: 32
- Findings resolved after their deadlines or still unresolved past deadline: 8
- Interpretation: 80% of due findings met compliance targets. The team needs to review the 8 overdue findings to find out whether delays stemmed from code complexity, dependency breakages, or conflicting sprint priorities.
Example 2: Calculating Security Testing Coverage Across Repositories
- Context: A company requires all active microservices to run automated SAST, SCA, and container image scans in their CI pipelines.
- Hypothetical Dataset:
- Total active, deployed repositories owned by the division: 120
- Repositories with fully configured, running pipelines meeting all three scanning requirements: 96
- Repositories running only one or two tools, or lacking pipeline integration entirely: 24
- Interpretation: 80% of active codebases meet baseline security requirements. The 24 non-compliant repositories represent blind spots that should be brought onto standardized pipeline templates.
Security KPIs vs. DevSecOps KPIs vs. Traditional DevOps Metrics
Understanding how different measurement frameworks relate to one another helps teams avoid confusion when setting goals and building dashboards.
| Dimension | Traditional Security KPIs | Traditional DevOps Metrics | DevSecOps Success KPIs |
| Primary Purpose | Gauge organizational compliance, audit readiness, and security risk posture. | Optimize software delivery speed, deployment frequency, and service reliability. | Measure how effectively security practices integrate with development workflows to reduce risk without slowing delivery. |
| Typical Measurements | Annual audit findings, penetration test defects, policy exception counts, firewall change logs. | Deployment Frequency, Lead Time for Changes, Change Failure Rate, Service Availability (uptime). | MTTR by severity, Vulnerability Escape Rate, Pipeline Security Gate Pass Rate, Supply-Chain Verification, DORA stability. |
| Primary Stakeholders | Chief Information Security Officer (CISO), internal auditors, compliance officers. | Software developers, engineering managers, DevOps and Site Reliability Engineering (SRE) teams. | DevSecOps engineers, application security teams, product owners, engineering managers, DevOps teams. |
| Primary Data Sources | Point-in-time penetration test reports, annual compliance audits, manual spreadsheets. | Git platforms, CI/CD tools, artifact registries, runtime observability systems. | Unified vulnerability management platforms, CI/CD pipeline telemetry, SCA/SAST tools, runtime security agents. |
| How Results Guide Action | Triggers manual audits, risk registers, and point-in-time remediation projects. | Prompts pipeline optimization, automated testing investments, and infrastructure stabilization. | Guides automated gate tuning, developer secure-coding training, automated dependency patching, and balanced risk-taking. |
DevSecOps metrics unite engineering velocity with defensive controls. Rather than replacing security judgment with a single composite score, DevSecOps measurement balances delivery performance with actionable risk reduction.
How to Choose the Right DevSecOps KPIs
Tracking too many metrics creates noise and obscures actionable priorities. Organizations can implement an effective measurement program by following a structured, ten-step selection process:
- Define Security and Business Objectives: Align your metrics with business priorities (such as customer data protection, regulatory compliance, or faster release cadence).
- Identify High-Risk Applications and Workflows: Focus initial measurement on revenue-critical, internet-exposed, or compliance-regulated systems before rolling programs out across internal tooling.
- Select a Focused Set of Actionable Metrics: Start with four to six meaningful indicators—such as MTTR for Critical findings, SLA Compliance, Testing Coverage, and Gate Pass Rates—rather than flooding teams with complex dashboards.
- Establish Consistent Definitions and Baselines: Document calculation methods, severity definitions, and inclusion criteria before publishing dashboards.
- Assign Ownership for Each Metric: Ensure every metric has a clear owner. For example, development teams own remediation SLAs, while platform security engineers own testing coverage and false-positive rates.
- Set Realistic, Risk-Based Targets: Base targets on team capacity, system complexity, and threat models. Avoid setting arbitrary zero-defect mandates that encourage teams to manipulate results.
- Integrate Reliable Data Sources: Ingest metrics directly from automated CI/CD tools, source code repositories, and vulnerability tracking platforms. Avoid using self-reported spreadsheets.
- Review Trends Rather than Single Points in Time: Look at multi-month rolling trends to identify systemic changes instead of overreacting to single-week spikes caused by newly announced CVEs.
- Improve the Underlying Process: Use metrics to fix root causes (such as updating base images or streamlining patch testing) rather than chasing numbers to make charts look better.
- Reassess Metrics Periodically: Retire or adjust KPIs that no longer provide actionable insight as your security maturity evolves.
Every organization operates with distinct regulatory requirements, risk tolerances, and technology stacks. What works for an early-stage startup running a single web service rarely makes sense for an enterprise managing distributed legacy workloads and strict compliance rules.
Tools Used to Collect and Monitor DevSecOps KPIs
Collecting reliable metrics requires automated tools across every stage of the software lifecycle.
       DevSecOps Tool Integration Architecture
       ───────────────────────────────────────
[ Code / Commit ] ──> Secret Scanners, SAST (e.g., SonarQube, GitHub Advanced Security)
        │
[ Build / Package ] ──> SCA & Container Scanners (e.g., Snyk, Trivy)
        │
[ Pipeline Engine ] ──> CI/CD Orchestration & Telemetry (e.g., Jenkins, GitLab CI)
        │
[ Test / Staging ] ──> DAST & API Security (e.g., OWASP ZAP)
        │
[ Deployment ] ───> Policy as Code (e.g., Open Policy Agent)
        │
[ Production ] ───> SIEM & Vulnerability Aggregators (e.g., DefectDojo, Grafana)
Common tool categories and the data they provide include:
- Static Application Security Testing (SAST): Tools like SonarQube analyze raw source code to surface code flaws, security debt, and coverage metrics.
- Software Composition Analysis (SCA): Tools such as Snyk scan project manifests to track third-party dependencies, open-source CVEs, and license risks.
- Secret Detection: Platforms like GitGuardian or native GitHub security features identify exposed credentials and API keys in commit histories.
- Dynamic Application Security Testing (DAST): Tools such as OWASP ZAP test running web applications from an external perspective, capturing escape rates and runtime flaws.
- Container and Infrastructure Scanning: Scanners evaluate Docker images and IaC templates to surface configuration drift and vulnerable packages.
- CI/CD Pipeline Platforms: Systems like Jenkins, GitLab CI/CD, and GitHub Actions generate operational metrics on build frequency, execution times, and gate pass rates.
- Vulnerability Management and Aggregation: Platforms like DefectDojo ingest findings from disparate scanners to track deduplicated backlogs, MTTR, and SLA compliance.
- SIEM and Observability Systems: Centralized logging and monitoring platforms capture MTTD, containment durations, and incident impacts across production environments.
No single platform can automatically track every DevSecOps KPI out of the box. Organizations typically build reliable metrics by aggregating telemetry from their CI/CD engines, scanning tools, and incident response systems into centralized reporting dashboards.
Practical Example: Measuring DevSecOps Success in a Software Team
To understand how these concepts work in practice, consider an illustrative scenario involving an engineering team building and operating a customer-facing e-commerce web platform.
Baseline Challenge
At the start of the year, the team lacked automated security testing. Security reviews were manual and occurred right before major releases. The team struggled with:
- An unmonitored backlog of third-party vulnerabilities.
- Frequent build delays caused by late security reviews.
- A long turnaround time of several weeks to patch critical vulnerabilities in production.
Implementing Measurement
Over a six-month period, the team took several steps to improve its processes:
- Automated Pipeline Checks: Added automated SCA, SAST, and container scanning into their CI/CD pipelines, using non-blocking notifications for the first 30 days to build a baseline.
- Clear Ownership: Integrated vulnerability findings directly into developer issue trackers, assigning them to the relevant feature teams.
- Established SLAs: Set remediation targets: 48 hours for Critical findings with public exploits, 14 days for High findings, and 45 days for Medium findings.
- Centralized Visibility: Connected pipeline events and vulnerability trackers to an engineering dashboard to review progress during bi-weekly sprint planning.
Sample Performance Dashboard
The table below illustrates a sample set of performance indicators tracked by this hypothetical team over a six-month improvement initiative. These figures are illustrative examples and do not represent universal industry targets.
| KPI | Illustrative Baseline (Month 1) | Illustrative Result (Month 6) | Practical Interpretation | Recommended Next Action |
| Critical & High Backlog | 42 unresolved vulnerabilities | 8 unresolved vulnerabilities | Backlog dropped significantly after initial triage, dependency updates, and removing unused packages. | Establish automated dependency update pull requests to keep the backlog from climbing again. |
| Remediation SLA Compliance | 35% compliant | 88% compliant | Most newly discovered critical issues are now fixed within policy deadlines, showing better prioritization. | Review the 12% of issues that missed SLAs to identify lingering patch blockers. |
| Security Testing Coverage | 20% of microservices | 95% of microservices | Standardizing CI/CD templates successfully brought almost all services under automated scanning. | Audit the remaining 5% of legacy microservices to resolve their configuration hurdles. |
| Security Gate Pass Rate | 50% first-pass pass rate | 86% first-pass pass rate | Developers now use local pre-commit checks and updated base images, cutting down on unexpected pipeline failures. | Tune scanner rules to suppress low-priority informational warnings that still trigger manual reviews. |
| Vulnerability Escape Rate | 28% found post-release | 9% found post-release | Pipeline checks are catching most flaws before release, sharply reducing vulnerabilities found in production. | Improve automated DAST and API integration tests in staging to catch remaining edge cases. |
| Deployment Frequency | 1 deployment every 2 weeks | 3 deployments per week | Delivery velocity improved alongside security checks by replacing manual gate reviews with automated policies. | Continue monitoring change failure rates to ensure high deployment frequency remains stable. |
This scenario shows how a team can interpret shifting metrics to make grounded engineering decisions. A drop in critical backlogs alongside improved deployment frequency demonstrates that automated security checks can help teams move faster, not slower, when implemented properly.
Common Mistakes When Measuring DevSecOps Success
Measuring DevSecOps performance can backfire if metrics are poorly chosen or misinterpreted. Here are the most common pitfalls and how to avoid them:
- Tracking Too Many KPIs: Inundating teams with dozens of metrics leads to dashboard fatigue. Fix: Focus on a core set of 4–6 actionable metrics that directly support near-term security and delivery priorities.
- Measuring Scan Activity Instead of Security Outcomes: Celebrating high scan counts while ignoring remediation throughput creates a false sense of security. Fix: Measure outcome-oriented indicators like MTTR, SLA compliance, and escape rates.
- Rewarding Raw Reduction in Vulnerability Counts: If teams are incentivized solely on reducing gross ticket counts, developers may downgrade severity ratings or mark complex issues as false positives. Fix: Focus reviews on SLA adherence, verified remediations, and root-cause fixes.
- Treating All Severities Equally: Giving equal weight to an unauthenticated remote exploit and an informational header recommendation misallocates engineering effort. Fix: Prioritize findings using contextual risk metrics, reachability analysis, and exploitability databases.
- Comparing Disparate Teams Directly: Comparing a greenfield cloud microservice directly against a 15-year-old legacy monolith creates friction and misrepresents progress. Fix: Evaluate each team’s progress against its own historical baseline and risk profile.
- Inconsistent Calculation Rules: Changing definitions, denominators, or measurement windows mid-stream invalidates trend analysis. Fix: Document and standardize metric definitions in an accessible internal engineering guide.
- Ignoring False Positives: Disregarding alert noise frustrates developers and leads them to bypass security controls. Fix: Track false-positive rates as a first-class operational metric and tune scanner rules regularly.
- Setting Unrealistic Remediation Deadlines: Mandating that all vulnerabilities regardless of severity be fixed within 24 hours leads to friction, missed deadlines, and ignored policies. Fix: Define balanced, risk-tiered SLAs that account for developer capacity and code review cadences.
- Using Metrics to Assign Blame: Weaponizing metrics against individuals discourages transparency and prompts engineers to hide flaws. Fix: Treat metrics as opportunities to improve systems, tools, and training rather than blaming developers.
- Overlooking Operational and Delivery Impact: Tightening security gates without monitoring DORA metrics can bring releases to a halt. Fix: Pair security metrics with deployment frequency and change failure rates to ensure velocity and security stay balanced.
Best Practices for Improving DevSecOps KPI Results
Improving your security metrics requires addressing underlying engineering workflows rather than artificially manipulating dashboard figures.
- Automate Security in Appropriate Pipeline Stages: Run fast checks (secret detection, linting, lightweight SAST) on local commits and pull requests, while shifting deeper, resource-intensive scans (DAST, full fuzzing) to post-merge or scheduled nightly builds to avoid slowing down developers.
- Prioritize Exploitable and Reachable Flaws: Use runtime contextual analysis and exploit intelligence to filter out noise, helping developers focus their efforts on reachable vulnerabilities.
- Clarify Remediation Ownership: Ensure that every repository, service, and cloud workload maps to an active team with allocated capacity for maintenance and patch management.
- Establish Risk-Based Remediation SLAs: Give development teams clear, predictable windows to remediate findings based on severity, system exposure, and exploitability.
- Provide Targeted Developer Security Training: Offer practical, hands-on training that teaches developers how to spot and fix specific vulnerabilities they frequently encounter in their pull requests.
- Include Security in Standard Code Reviews: Use security linters and automated comments within pull requests to catch flaws during peer review before code merges to main branches.
- Actively Manage Third-Party Dependencies: Implement automated dependency update tools to patch vulnerable open-source libraries regularly, keeping technical debt manageable.
- Audit Exceptions and Overdue Findings: Establish an auditable process for time-bound risk acceptance exceptions, ensuring skipped checks receive formal security approval and regular reviews.
- Conduct Incident Drills and Blameless Post-Mortems: Run tabletop incident exercises to evaluate detection and response readiness, and conduct blameless post-mortems after real-world incidents to address systemic weaknesses.
- Ensure Data Integrity Across Tools: Normalize vulnerability data across different scanners into a centralized platform to maintain clean, deduplicated, and consistent metrics over time.
How DevOpsSchool Relates to DevSecOps Learning
Improving DevSecOps KPIs requires technical skill, operational discipline, and a shared engineering culture across development, operations, and security teams. When organizations build out these practices, teams often benefit from structured technical learning to master the complex tools and workflows involved.
DevOpsSchool is an established technical education and training provider focused on DevOps, cloud architectures, continuous delivery, and related engineering disciplines. The organization provides structured learning programs designed to help technical professionals build practical skills in key modern engineering areas:
- CI/CD Pipeline Automation: Building, optimizing, and maintaining automated deployment workflows across platforms like Jenkins, GitLab CI/CD, and GitHub Actions.
- Containerization and Orchestration: Securing and managing containerized workloads using Docker, Kubernetes, and cloud-native registries.
- Infrastructure as Code (IaC): Writing, auditing, and governing declarative infrastructure definitions using Terraform, Ansible, and policy validation frameworks.
- Site Reliability and Monitoring: Setting up centralized logging, telemetry, and observability tools to track system health and operational metrics.
- Cross-Functional Collaboration: Implementing practical workflows that help development, operations, and security specialists collaborate smoothly throughout the software delivery lifecycle.
For engineering teams looking to improve their DevSecOps performance, structured training provides the technical foundation engineers need to design automated guardrails, interpret security alerts accurately, and maintain steady delivery velocity without compromising system security.
Frequently Asked Questions (FAQs)
What are DevSecOps success KPIs?
DevSecOps success KPIs are quantifiable indicators used to evaluate how effectively an organization integrates security practices into its software development and delivery lifecycles. They measure vulnerability remediation performance, testing coverage, automated gate efficiency, incident response capabilities, and overall risk reduction without compromising delivery velocity.
Which KPIs are most important for a DevSecOps team?
While priorities vary by organization, most teams focus on a core set of actionable metrics: Mean Time to Remediate (MTTR) segmented by severity, Remediation SLA Compliance, Critical and High Vulnerability Backlog, Vulnerability Escape Rate, Security Testing Coverage, and DORA delivery metrics.
How is vulnerability remediation time calculated?
Mean Time to Remediate (MTTR) is calculated by dividing the total calendar time spent resolving and verifying a set of vulnerabilities by the number of resolved vulnerabilities in that dataset. To provide meaningful insight, it should be segmented by severity, exploitability, and asset exposure.
What is a good vulnerability remediation SLA?
A standard industry SLA framework requires Critical vulnerabilities (especially those with known public exploits) to be remediated within 24 to 72 hours, High vulnerabilities within 7 to 14 days, Medium vulnerabilities within 30 to 60 days, and Low vulnerabilities within 90 days or normal release cycles. Exact targets depend on an organization’s specific risk tolerance and regulatory environment.
How do organizations measure security testing coverage?
Security testing coverage is measured by dividing the number of in-scope repositories, builds, or pipelines that complete required security checks (such as SAST, SCA, container scanning, and secret detection) by the total number of active in-scope items, expressed as a percentage.
What is a vulnerability escape rate?
A vulnerability escape rate measures the proportion of vulnerabilities that slip past automated pre-release pipeline checks and are discovered only after deployment to production or staging environments. It highlights blind spots in pre-release testing tools and policies.
How do DevSecOps KPIs differ from DevOps metrics?
Traditional DevOps metrics focus primarily on delivery velocity and service availability (such as deployment frequency, lead time, and uptime). DevSecOps KPIs incorporate these delivery indicators while adding security measurements—such as vulnerability discovery and remediation, policy compliance, and incident response efficiency—to ensure release speed does not undermine system protection.
Which tools help track DevSecOps KPIs?
Teams track these metrics by combining data from several tool categories: static and dynamic analyzers (such as SonarQube and OWASP ZAP), software composition and dependency tools (such as Snyk), CI/CD engines (such as Jenkins or GitLab CI/CD), vulnerability management aggregators (such as DefectDojo), and centralized reporting dashboards (such as Grafana).
How often should DevSecOps KPIs be reviewed?
Operational metrics like gate pass rates, pipeline test execution, and critical vulnerabilities are typically reviewed continuously or during bi-weekly sprint planning. Broader metrics—such as MTTR trends, SLA compliance, testing coverage, and vulnerability escape rates—are usually evaluated monthly or quarterly by engineering leads and security managers.
Can a high security testing coverage percentage guarantee secure software?
No. High testing coverage simply confirms that automated tools ran across your repositories. If those tools use outdated rule sets, miss business logic flaws, or produce noisy alerts that developers routinely ignore, applications can maintain high coverage numbers while remaining vulnerable to attack.
Final Thoughts
Tracking DevSecOps success KPIs gives engineering organizations the objective, empirical data they need to build secure software without slowing down release cycles. Moving beyond vanity activity metrics—such as the total number of scans executed or raw alert counts—allows teams to focus on meaningful security outcomes: reducing exploitable attack surfaces, resolving vulnerabilities within predictable windows, catching defects before release, and maintaining operational stability.
Building an effective measurement program requires clear, consistent metric definitions, automated data collection across the CI/CD pipeline, and risk-adjusted targets that align with business goals. Most importantly, performance metrics should never be used as a blunt instrument to assign personal blame. When teams use them constructively, KPIs highlight systemic bottlenecks, justify investments in developer tooling, guide training programs, and strengthen collaboration across development, security, and operations.
Organizations looking to strengthen their technical capabilities can use structured learning programs, such as those offered by DevOpsSchool, to build the foundational skills needed for automated pipelines, infrastructure management, and secure software delivery. In the end, the ultimate goal of DevSecOps KPIs is not to produce visually impressive management dashboards—it is to cultivate a resilient, high-velocity engineering culture that consistently delivers dependable, secure software to production.





Leave a Reply
You must be logged in to post a comment.