Introduction & Overview
What is Fluentd?
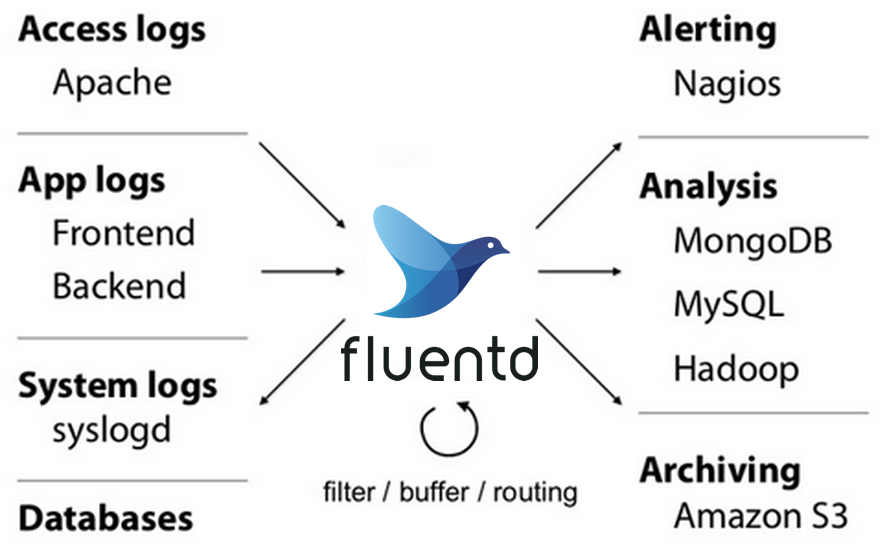
Fluentd is an open-source data collection and logging tool designed to unify the logging layer across diverse systems. It collects, processes, and forwards log data from various sources to multiple destinations, acting as a flexible and scalable log aggregator. Written primarily in Ruby, Fluentd is lightweight, extensible, and supports over 500 plugins to integrate with databases, cloud services, and monitoring tools.
History or Background
Fluentd was created by Sadayuki Furuhashi in 2011 under the Cloud Native Computing Foundation (CNCF). It emerged to address the challenge of managing logs in distributed, heterogeneous environments. Initially developed to handle web server logs, Fluentd evolved into a robust solution for modern cloud-native architectures, achieving CNCF graduation status in 2019. Its plugin-based architecture and community-driven development have made it a staple in DevOps and DevSecOps pipelines.
Why is it Relevant in DevSecOps?
In DevSecOps, security is integrated into every phase of the software development lifecycle (SDLC). Fluentd plays a critical role by:
- Centralizing Logs: Aggregates logs from applications, infrastructure, and security tools, enabling unified monitoring and auditing.
- Enabling Real-Time Analysis: Supports real-time log processing for detecting security incidents or anomalies.
- Ensuring Compliance: Facilitates audit trails and compliance with standards like GDPR, HIPAA, or SOC 2 by structuring and storing logs securely.
- Automating Workflows: Integrates with CI/CD pipelines and security tools to automate log-based incident response.
Core Concepts & Terminology
Key Terms and Definitions
- Event: A single log entry with a timestamp, tag, and record (data payload).
- Tag: A string identifier used to route events to specific outputs or processing rules.
- Plugin: Modular components for input, output, filter, parser, formatter, or buffer, extending Fluentd’s functionality.
- Buffer: Temporary storage for events to handle bursts or network issues.
- Match Directive: Configuration rule to route events based on tags to specific outputs.
- Source: The origin of log data (e.g., files, HTTP endpoints, or system logs).
How it Fits into the DevSecOps Lifecycle
Fluentd integrates into the DevSecOps lifecycle as follows:
- Plan & Code: Collects logs from development environments and IDEs to track coding activities.
- Build & Test: Gathers CI/CD pipeline logs (e.g., Jenkins, GitLab) to monitor build and test failures.
- Release & Deploy: Monitors deployment logs for errors or unauthorized changes.
- Operate & Monitor: Aggregates runtime logs for performance monitoring and security incident detection.
- Secure: Enables security auditing, anomaly detection, and compliance reporting by feeding logs to SIEM (Security Information and Event Management) systems.
Architecture & How It Works
Components and Internal Workflow
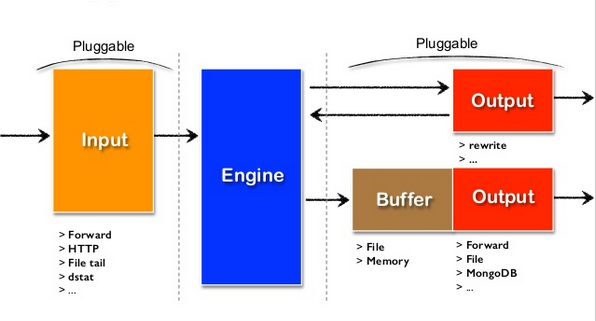
Fluentd operates as a data pipeline with the following components:
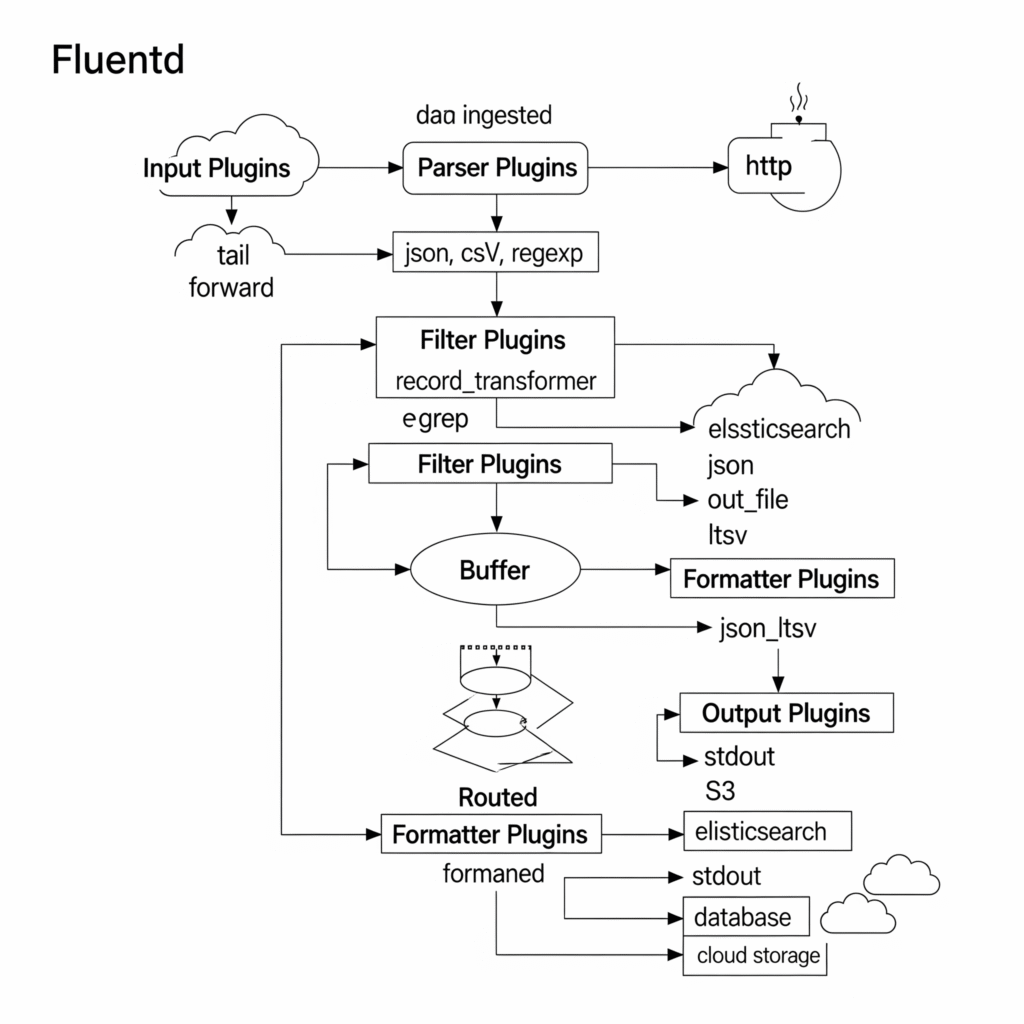
- Input Plugins: Collect data from sources like log files, HTTP, or message queues (e.g.,
in_tail,in_http). - Parser Plugins: Parse raw log data into structured JSON events.
- Filter Plugins: Process or transform events (e.g., enrich, anonymize, or filter sensitive data).
- Buffer: Temporarily stores events to ensure reliable delivery.
- Output Plugins: Forward events to destinations like Elasticsearch, S3, or Kafka.
- Formatter Plugins: Convert events into specific formats (e.g., JSON, CSV) for output.
Workflow:
- Logs are ingested via input plugins.
- Events are tagged and parsed into structured format.
- Filters process or enrich events (e.g., adding metadata or removing sensitive data).
- Buffered events are routed to outputs based on match directives.
- Outputs deliver events to storage or analysis systems.
[Input] -> [Parser] -> [Filter] -> [Buffer] -> [Output]Architecture Diagram (Textual Description)
Imagine a flowchart with the following structure:
- Left: Input sources (e.g., Application Logs, Syslog, Docker) feed into Fluentd.
- Center: Fluentd core with layers for Input Plugins → Parser → Filter → Buffer → Output Plugins.
- Right: Outputs to destinations like Elasticsearch, AWS S3, or Splunk.
- Arrows: Show data flow from sources through Fluentd to destinations, with filters and buffers as intermediate steps.
- Security Layer: A dotted line around Fluentd indicating encryption, access control, and audit logging.
+-----------+     +---------+     +--------+     +---------+     +----------+
|  Inputs   | --> | Parsers | --> |Filters | --> | Buffers | --> | Outputs  |
+-----------+     +---------+     +--------+     +---------+     +----------+
       |               |              |              |              |
     Sources      Log format     Enrichment     Load control     Destinations
Integration Points with CI/CD or Cloud Tools
Fluentd integrates seamlessly with:
- CI/CD Tools: Jenkins, GitLab, or CircleCI for build and deployment logs.
- Cloud Platforms: AWS (CloudWatch, S3), GCP (Stackdriver), Azure (Monitor).
- Monitoring Tools: Prometheus, Grafana, or Splunk for visualization and alerting.
- SIEM Systems: Splunk, Elastic SIEM, or QRadar for security analysis.
- Containerized Environments: Kubernetes and Docker via plugins like
in_kubernetes.
Installation & Getting Started
Basic Setup or Prerequisites
- Operating System: Linux, macOS, or Windows (Linux recommended for production).
- Dependencies: Ruby (version 2.5 or higher),
gcc, andmake. - Network Access: Ensure access to Fluentd gem repository and output destinations.
- Hardware: Minimum 1GB RAM, 1 CPU core for small-scale setups.
Hands-on: Step-by-Step Beginner-Friendly Setup Guide
Below is a guide to set up Fluentd on a Linux system and configure it to collect and forward logs to Elasticsearch.
- Install Fluentd:
sudo apt update
sudo apt install -y ruby ruby-dev gcc make
sudo gem install fluentd
2. Create Configuration File:
Create a file named fluentd.conf in /etc/fluentd/:
sudo mkdir /etc/fluentd
sudo nano /etc/fluentd/fluentd.conf
Add the following configuration to collect logs from a file and forward to Elasticsearch:
<source>
  @type tail
  path /var/log/app.log
  pos_file /var/log/fluentd/app.log.pos
  tag app.log
  <parse>
    @type json
  </parse>
</source>

<filter app.log>
  @type record_transformer
  <record>
    hostname "#{Socket.gethostname}"
  </record>
</filter>

<match app.log>
  @type elasticsearch
  host elasticsearch
  port 9200
  index_name fluentd
  type_name _doc
</match>
3. Start Fluentd:
fluentd -c /etc/fluentd/fluentd.conf4. Test the Setup:
Create a sample log file and add a JSON log entry:
echo '{"message": "Test log entry"}' >> /var/log/app.log5. Set Up as a Service (Optional):
Create a systemd service file:
sudo nano /etc/systemd/system/fluentd.serviceAdd:
[Unit]
Description=Fluentd Log Collector
After=network.target

[Service]
ExecStart=/usr/local/bin/fluentd -c /etc/fluentd/fluentd.conf
Restart=always

[Install]
WantedBy=multi-user.target
Enable and start the service:
sudo systemctl enable fluentd
sudo systemctl start fluentd
Real-World Use Cases
- Centralized Logging in Kubernetes:
- Scenario: A DevSecOps team manages a Kubernetes cluster hosting microservices. Fluentd is deployed as a DaemonSet to collect container logs and forward them to Elasticsearch for analysis.
- Application: Detects failed deployments or unauthorized pod changes by analyzing logs in real time.
- Industry: E-commerce platforms monitoring user activity and transaction logs.
- Security Incident Detection:
- Scenario: A financial institution uses Fluentd to collect logs from firewalls, application servers, and authentication systems, forwarding them to a SIEM like Splunk.
- Application: Identifies brute-force login attempts or suspicious API calls through pattern matching.
- Industry: Finance for compliance with PCI-DSS.
- Compliance Auditing:
- Scenario: A healthcare provider uses Fluentd to aggregate access logs from EHR (Electronic Health Record) systems, storing them in AWS S3 for audit purposes.
- Application: Ensures HIPAA compliance by maintaining immutable logs with timestamps and user metadata.
- Industry: Healthcare for regulatory reporting.
- CI/CD Pipeline Monitoring:
- Scenario: A software company integrates Fluentd with Jenkins to collect build and test logs, forwarding them to Grafana for visualization.
- Application: Tracks pipeline failures and correlates them with code changes for root cause analysis.
- Industry: Software development for agile teams.
Benefits & Limitations
Key Advantages
- Flexibility: Over 500 plugins support diverse sources and destinations.
- Scalability: Handles high log volumes with buffering and load balancing.
- Open Source: Free with a strong community and CNCF backing.
- Security Features: Supports TLS encryption and role-based access for outputs.
- Ease of Use: Simple configuration syntax and extensive documentation.
Common Challenges or Limitations
- Performance Overhead: High log volumes may require tuning buffers or scaling instances.
- Ruby Dependency: Requires Ruby expertise for custom plugins or debugging.
- Complex Configurations: Large setups with multiple plugins can become hard to manage.
- Resource Usage: Memory and CPU usage can spike without optimization.
Best Practices & Recommendations
Security Tips
- Enable TLS: Use SSL/TLS for input and output plugins to encrypt data in transit.
- Filter Sensitive Data: Use
filter_record_transformerto anonymize PII (Personally Identifiable Information). - Access Control: Restrict Fluentd ports and use authentication for output destinations.
Performance
- Optimize Buffers: Configure memory or file-based buffers to handle bursts.
- Parallel Processing: Use multi-threading or multi-process modes for high throughput.
- Monitor Resource Usage: Integrate with Prometheus to track Fluentd metrics.
Maintenance
- Regular Updates: Keep Fluentd and plugins updated to avoid vulnerabilities.
- Log Rotation: Configure log rotation for Fluentd’s own logs to prevent disk issues.
Compliance Alignment
- Immutable Logs: Store logs in tamper-proof storage like AWS S3 with versioning.
- Audit Trails: Use tags to track log sources for traceability.
- Retention Policies: Set retention periods in output plugins to comply with regulations.
Automation Ideas
- CI/CD Integration: Automate Fluentd deployment using Ansible or Terraform.
- Alerting: Configure output plugins to trigger alerts via webhooks or Slack.
Comparison with Alternatives
| Feature | Fluentd | Logstash | Filebeat |
|---|---|---|---|
| Architecture | Plugin-based, lightweight | Heavyweight, JVM-based | Lightweight, focused on file logs |
| Performance | Moderate, tunable | High memory/CPU usage | Highly efficient for file forwarding |
| Plugins | 500+ plugins | Extensive but fewer than Fluentd | Limited, focused on Elastic stack |
| Ease of Setup | Simple configuration | Complex setup, steeper learning curve | Easy for Elastic integrations |
| Security Features | TLS, filtering, authentication | TLS, advanced filtering | TLS, basic filtering |
| Use Case Fit | General-purpose logging | Complex ETL pipelines | Lightweight log shipping |
When to Choose Fluentd
- Choose Fluentd: For cloud-native environments, Kubernetes, or when you need a lightweight, flexible solution with extensive plugin support.
- Choose Logstash: For complex ETL (Extract, Transform, Load) pipelines with heavy data transformation needs.
- Choose Filebeat: For simple file-based log shipping to Elasticsearch with minimal resource usage.
Conclusion
Fluentd is a powerful and versatile tool for unifying logging in DevSecOps, enabling centralized log management, real-time security monitoring, and compliance auditing. Its plugin-based architecture and integration capabilities make it ideal for modern, distributed systems. As organizations adopt cloud-native and microservices architectures, Fluentd’s role in DevSecOps will grow, especially with advancements in AI-driven log analysis and automation.
Thank you for your sharing. I am worried that I lack creative ideas. It is your article that makes me full of hope. Thank you. But, I have a question, can you help me?