Introduction & Overview
What is OpenTelemetry?
OpenTelemetry is an open-source observability framework that standardizes the collection, processing, and export of telemetry data—metrics, traces, and logs—from applications and infrastructure. It provides a vendor-neutral, unified approach to instrumenting systems, enabling developers and operations teams to monitor and troubleshoot applications effectively.

History or Background
OpenTelemetry was formed in 2019 under the Cloud Native Computing Foundation (CNCF) by merging OpenTracing and OpenCensus. The goal was to create a single, comprehensive observability standard to replace fragmented tools. It reached General Availability (GA) for tracing in 2021 and metrics in 2022, with logging support maturing by 2025. As a CNCF incubating project, it is widely adopted across industries.
Why is it Relevant in DevSecOps?
In DevSecOps, observability is critical for integrating security into the development lifecycle. OpenTelemetry supports this by enabling:
- Real-time monitoring: Tracks application performance and security events.
- Incident response: Provides detailed traces for root cause analysis of security breaches.
- Compliance: Generates auditable logs for regulatory requirements.
- Collaboration: Unifies data for Dev, Sec, and Ops teams to align on system health.
Core Concepts & Terminology
Key Terms and Definitions
- Telemetry: Data about system performance, including metrics (numerical data), traces (request paths), and logs (event records).
- Instrumentation: Code added to applications to generate telemetry data.
- Span: A single unit of work in a trace, representing an operation (e.g., HTTP request).
- Collector: A component that receives, processes, and exports telemetry data.
- Exporter: Sends telemetry data to backend systems like Prometheus or Jaeger.
| Term | Description |
|---|---|
| Span | A single operation or unit of work in a trace |
| Trace | A collection of spans forming a complete request path |
| Metric | Numeric data over time (e.g., CPU usage, error rates) |
| Log | Event records produced by applications |
| Instrumentation | Code or libraries that emit telemetry |
| Collector | Agent to receive, process, and export telemetry data |
| Exporter | Sends data to observability platforms (e.g., Grafana, Jaeger) |
How It Fits into the DevSecOps Lifecycle
OpenTelemetry integrates across the DevSecOps pipeline:
- Plan/Code: Instrument code for observability during development.
- Build/Test: Monitor CI/CD pipelines for performance and security issues.
- Deploy: Track deployment health and detect anomalies.
- Operate/Monitor: Provide real-time insights for incident response and compliance.
Architecture & How It Works
Components and Internal Workflow
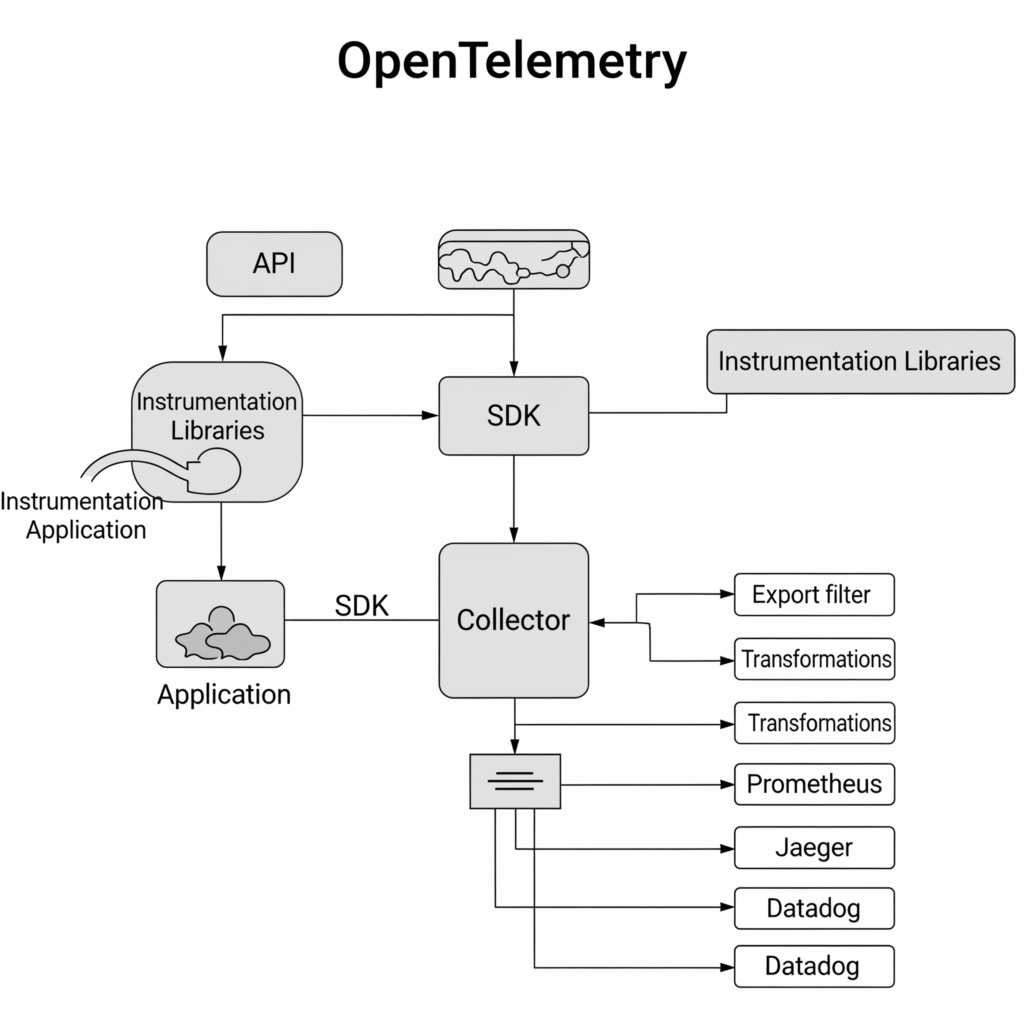
OpenTelemetry consists of:
- API: Language-specific interfaces for generating telemetry data.
- SDK: Implements the API, handling data collection and processing.
- Collector: A standalone service that aggregates and exports telemetry.
- Instrumentation Libraries: Pre-built libraries for frameworks like Flask or Spring.
The workflow is:
- Application instrumentation generates telemetry.
- SDK processes and batches data.
- Collector receives and exports data to backends.
Architecture Diagram Description
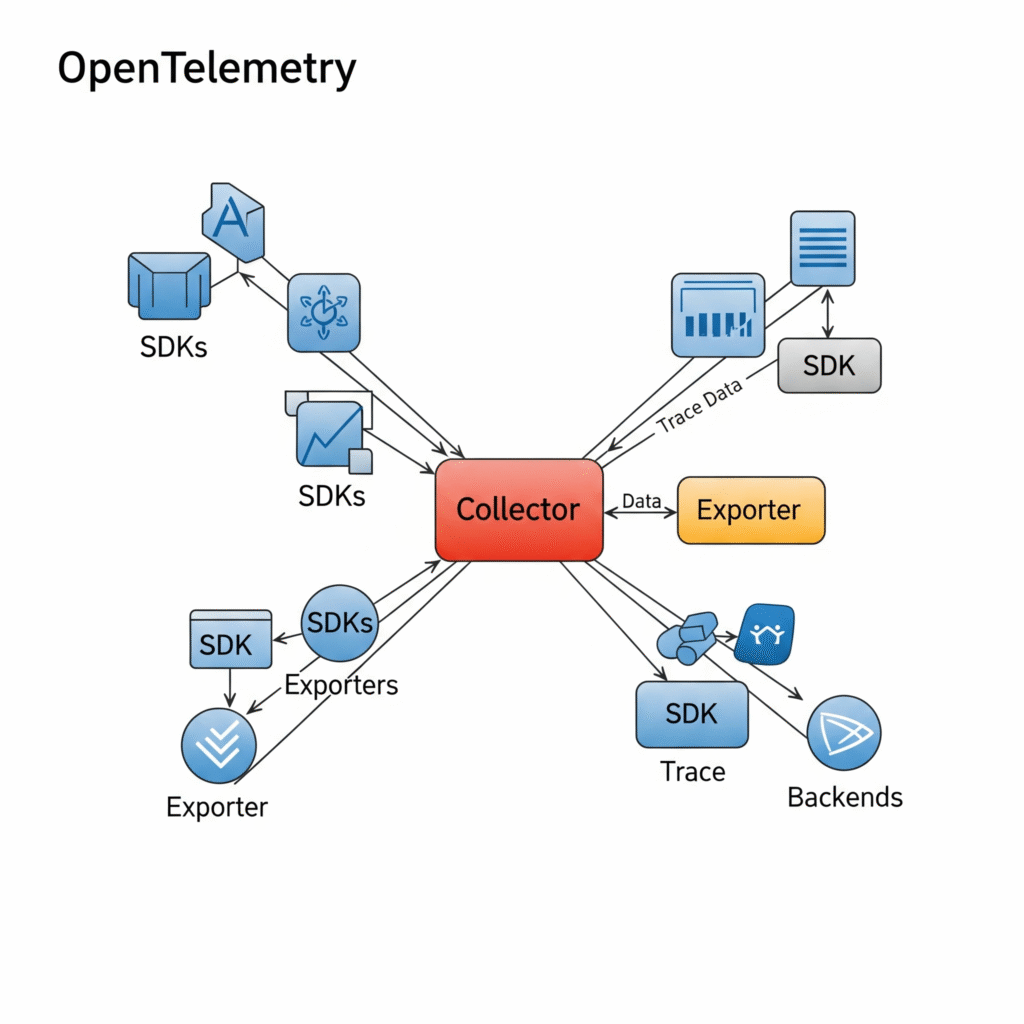
The architecture can be visualized as a flow:
- Application (instrumented with OpenTelemetry SDK) sends spans, metrics, and logs.
- Collector (deployed as a sidecar or standalone) receives data via receivers.
- Processors in the Collector filter or enrich data.
- Exporters send data to backends like Prometheus (metrics), Jaeger (traces), or Loki (logs).
- Backends visualize and store data for analysis.
[ Application ]
     | (SDKs / Auto-Instrumentation)
     v
[ OpenTelemetry Collector ]
     | --> Exporter: [Prometheus / Jaeger / Splunk / Datadog]
     | --> Logs: [ELK Stack]
     | --> Security Analytics: [SIEM / CloudWatch / XDR tools]
Integration Points with CI/CD or Cloud Tools
OpenTelemetry integrates with:
- CI/CD: Jenkins or GitLab pipelines use OpenTelemetry to monitor build performance.
- Cloud: AWS CloudWatch, Google Cloud Monitoring, or Azure Monitor ingest telemetry.
- Orchestrators: Kubernetes sidecars collect container telemetry.
Installation & Getting Started
Basic Setup or Prerequisites
- Environment: Python 3.8+, Docker, or Kubernetes for Collector.
- Tools: A backend like Jaeger or Prometheus for visualization.
- Dependencies: OpenTelemetry SDK and instrumentation libraries.
Hands-on: Step-by-Step Beginner-Friendly Setup Guide
This guide sets up OpenTelemetry for a Python Flask app with Jaeger as the backend.
- Install Dependencies:
pip install opentelemetry-api opentelemetry-sdk opentelemetry-instrumentation-flask opentelemetry-exporter-jaeger- Set Up Jaeger:
Run Jaeger in Docker:
docker run -d --name jaeger \
  -e COLLECTOR_ZIPKIN_HTTP_PORT=9411 \
  -p 5775:5775/udp \
  -p 6831:6831/udp \
  -p 6832:6832/udp \
  -p 16686:16686 \
jaegertracing/all-in-one:latest- Instrument Flask App:
Createapp.py:
from flask import Flask
from opentelemetry import trace
from opentelemetry.instrumentation.flask import FlaskInstrumentor
from opentelemetry.exporter.jaeger.thrift import JaegerExporter
from opentelemetry.sdk.trace import TracerProvider
from opentelemetry.sdk.trace.export import BatchSpanProcessor

app = Flask(__name__)

# Set up tracer
trace.set_tracer_provider(TracerProvider())
tracer = trace.get_tracer(__name__)

# Configure Jaeger exporter
jaeger_exporter = JaegerExporter(agent_host_name='localhost', agent_port=6831)
span_processor = BatchSpanProcessor(jaeger_exporter)
trace.get_tracer_provider().add_span_processor(span_processor)

# Instrument Flask
FlaskInstrumentor().instrument_app(app)

@app.route('/')
def hello():
    with tracer.start_as_current_span("example-span"):
        return "Hello, OpenTelemetry!"

if __name__ == '__main__':
app.run()- Run the App:
python app.py- View Traces: Open http://localhost:16686 to see traces in Jaeger.
Real-World Use Cases
Scenario 1: Microservices Monitoring
A fintech company uses OpenTelemetry to trace requests across microservices in a Kubernetes cluster, identifying latency in payment processing and detecting unauthorized API calls.
Scenario 2: Security Incident Detection
A healthcare provider instruments its APIs with OpenTelemetry to log access patterns, enabling real-time detection of suspicious activities like brute-force attacks.
Scenario 3: Compliance Auditing
A retail company uses OpenTelemetry logs to generate audit trails for PCI DSS compliance, tracking user actions across its e-commerce platform.
Scenario 4: CI/CD Pipeline Observability
A DevOps team instruments Jenkins pipelines with OpenTelemetry to monitor build times and detect failures, integrating with Prometheus for alerting.
Benefits & Limitations
Key Advantages
- Vendor Neutral: Works with any observability backend.
- Unified Telemetry: Combines metrics, traces, and logs.
- Community Support: Backed by CNCF with extensive libraries.
Common Challenges or Limitations
- Complexity: Steep learning curve for large-scale deployments.
- Performance Overhead: Instrumentation can add latency.
- Log Support Maturity: Logging is less mature than tracing and metrics.
Best Practices & Recommendations
Security Tips
- Encrypt telemetry data in transit using TLS.
- Restrict Collector access with authentication.
- Filter sensitive data (e.g., PII) before exporting.
Performance and Maintenance
- Use sampling to reduce data volume.
- Deploy Collectors as sidecars for scalability.
- Monitor Collector health to avoid bottlenecks.
Compliance Alignment and Automation
- Map telemetry to compliance requirements (e.g., GDPR, HIPAA).
- Automate instrumentation in CI/CD with tools like Helm or Ansible.
Comparison with Alternatives
| Feature | OpenTelemetry | Prometheus + Jaeger |
|---|---|---|
| Telemetry Types | Metrics, traces, logs | Metrics (Prometheus), traces (Jaeger) |
| Vendor Neutrality | Yes | Partial (backend-specific) |
| Ease of Setup | Moderate | Complex (multiple tools) |
| Community Support | CNCF, broad adoption | Strong, but fragmented |
| Use Case | Unified observability | Specialized monitoring |
When to Choose OpenTelemetry
Choose OpenTelemetry for unified telemetry, multi-backend support, or future-proofing. Use alternatives like Prometheus for metrics-only or Jaeger for tracing-only scenarios.
Conclusion
OpenTelemetry is a powerful tool for DevSecOps, enabling unified observability, enhanced security, and compliance. Its adoption is growing, with future trends focusing on AI-driven anomaly detection and tighter cloud integrations. To get started, explore the official documentation at https://opentelemetry.io/docs/ and join the CNCF Slack community.