Introduction & Overview
What is Prometheus?
Prometheus is an open-source, time-series-based monitoring and alerting toolkit designed for reliability and scalability. It excels in collecting and querying metrics from dynamic, cloud-native environments, making it a cornerstone for observability in DevSecOps pipelines.
History or Background
Prometheus was created by SoundCloud in 2012 to address the need for robust monitoring in microservices architectures. Inspired by Google’s Borgmon, it was open-sourced and became a Cloud Native Computing Foundation (CNCF) graduated project in 2018. Its adoption has grown due to its flexibility, powerful query language (PromQL), and integration with modern DevOps tools.
Why is it Relevant in DevSecOps?
In DevSecOps, security, development, and operations converge to deliver secure, high-quality software at speed. Prometheus supports this by:
- Providing real-time visibility into system performance and security metrics.
- Enabling automated alerts for anomalies, such as unauthorized access or resource abuse.
- Integrating with CI/CD pipelines and cloud platforms to monitor the entire software lifecycle.
- Supporting compliance through auditable metrics and logs.
Core Concepts & Terminology
Key Terms and Definitions
- Metric: A numerical measurement (e.g., CPU usage, request latency) collected over time.
- PromQL: Prometheus Query Language, used to query and analyze metrics.
- Exporter: A tool that collects metrics from third-party systems and exposes them in a Prometheus-compatible format.
- Scrape: The process of periodically collecting metrics from configured endpoints.
- Alertmanager: A component for handling alerts, routing them to notification systems.
- Time-Series Database: Stores metrics as time-stamped data points.
| Term | Definition |
|---|---|
| Metric | A numeric representation of data measured over time. |
| Time Series | A stream of timestamped values belonging to the same metric and label set. |
| Label | Key-value pairs that differentiate time series. |
| Scraping | The process Prometheus uses to collect metrics from targets. |
| Exporter | A service that exposes metrics in a format Prometheus can scrape. |
| Alertmanager | Handles alerts generated by Prometheus, with routing, deduplication, etc. |
| Service Discovery | Mechanism to automatically find scrape targets. |
How it Fits into the DevSecOps Lifecycle
Prometheus aligns with DevSecOps by:
- Plan & Code: Monitors code quality metrics (e.g., build failures, test coverage).
- Build & Test: Tracks CI/CD pipeline performance and security vulnerabilities.
- Deploy: Ensures infrastructure health during deployments.
- Operate: Detects runtime issues, such as memory leaks or unauthorized API calls.
- Monitor: Provides continuous observability for security and performance.
| DevSecOps Phase | Prometheus Role |
|---|---|
| Plan | Provides historical metrics for better planning. |
| Develop | Monitors feature branches for performance/security regressions. |
| Build | Tracks build times, failures, and resource usage. |
| Test | Correlates test performance with infrastructure metrics. |
| Release | Ensures smooth deployment through metrics-based canaries. |
| Deploy | Real-time monitoring of deployment health and performance. |
| Operate | Continuous monitoring with anomaly detection and alerting. |
| Monitor | Central pillar for observability, compliance, and audit logs. |
Architecture & How It Works
Components and Internal Workflow
Prometheus consists of:
- Prometheus Server: Scrapes metrics, stores them in a time-series database, and evaluates rules for alerts.
- Client Libraries: Instrument applications to expose custom metrics.
- Exporters: Collect metrics from systems like databases or hardware.
- Alertmanager: Manages alerts, deduplicates, and routes notifications.
- Service Discovery: Dynamically finds scrape targets in cloud environments.
- Pushgateway: Handles metrics from short-lived jobs.
Workflow: Prometheus scrapes metrics from configured endpoints (e.g., /metrics), stores them, and allows querying via PromQL. Alerts are triggered based on predefined rules and sent via Alertmanager.
Architecture Diagram
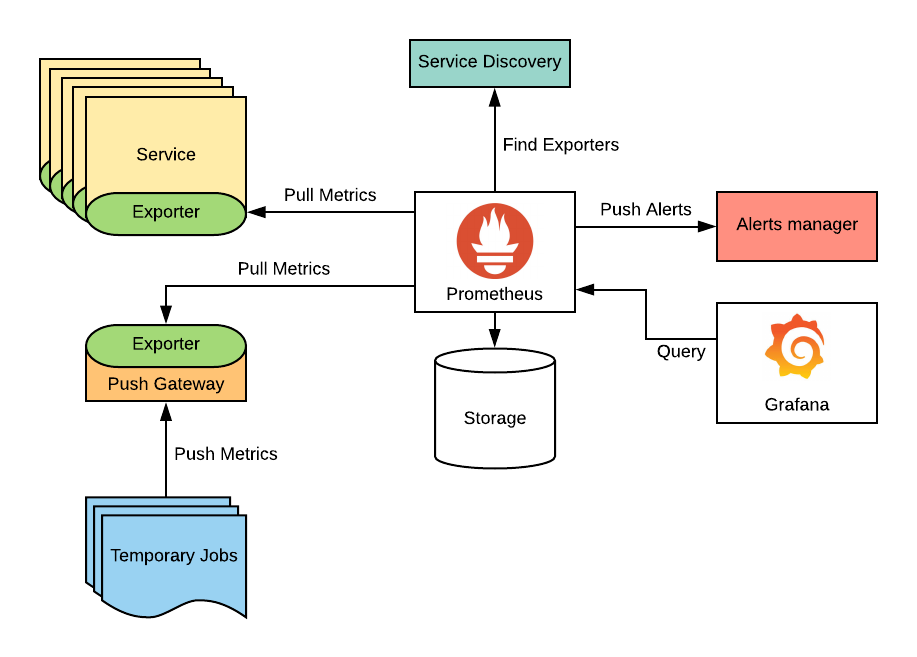
Imagine a diagram with:
- A central Prometheus Server connected to a time-series database.
- Arrows pointing to Exporters (e.g., Node Exporter, MySQL Exporter).
- Service Discovery linking to cloud providers (e.g., AWS, Kubernetes).
- Alertmanager routing alerts to email, Slack, or PagerDuty.
- Grafana (optional) for visualizing metrics.
+---------------------+
|   Prometheus Server |
+---------------------+
         |
         | <-- Scrapes metrics via HTTP
         v
+---------------------+     +--------------------+
|     Exporters       | <-- |    Applications     |
+---------------------+     +--------------------+
         |
         v
+---------------------+
|    Time Series DB    |
+---------------------+
         |
         v
+----------------------+
|    Alert Manager     |
+----------------------+
         |
         v
+----------------------+
| Email / Slack / etc. |
+----------------------+
Integration Points with CI/CD or Cloud Tools
Prometheus integrates with:
- CI/CD: Jenkins, GitLab CI, or GitHub Actions via exporters to monitor pipeline health.
- Cloud: Kubernetes (via kube-state-metrics), AWS, Azure, or GCP through service discovery.
- Visualization: Grafana for dashboards.
- Security Tools: Integrates with Falco or Sysdig for runtime security monitoring.
Installation & Getting Started
Basic Setup or Prerequisites
- Operating System: Linux, macOS, or Windows.
- Tools: Docker (optional), wget or curl, basic networking knowledge.
- Hardware: 2GB RAM, 10GB storage (minimum for small setups).
- Ports: 9090 (Prometheus), 9093 (Alertmanager).
Hands-on: Step-by-Step Beginner-Friendly Setup Guide
This guide sets up Prometheus on a Linux system using a binary installation.
- Download Prometheus:
   wget https://github.com/prometheus/prometheus/releases/download/v2.51.0/prometheus-2.51.0.linux-amd64.tar.gz
   tar xvfz prometheus-*.tar.gz
cd prometheus-*- Configure Prometheus:
Create aprometheus.ymlfile:
   global:
     scrape_interval: 15s
   scrape_configs:
     - job_name: 'prometheus'
       static_configs:
- targets: ['localhost:9090']- Run Prometheus:
./prometheus --config.file=prometheus.ymlAccess the UI at http://localhost:9090.
- Install Node Exporter (for system metrics):
   wget https://github.com/prometheus/node_exporter/releases/download/v1.8.0/node_exporter-1.8.0.linux-amd64.tar.gz
   tar xvfz node_exporter-*.tar.gz
   cd node_exporter-*
   ./node_exporter
Update prometheus.yml to scrape Node Exporter:
   scrape_configs:
     - job_name: 'node'
       static_configs:
- targets: ['localhost:9100']- Set Up Alertmanager (optional):
   wget https://github.com/prometheus/alertmanager/releases/download/v0.27.0/alertmanager-0.27.0.linux-amd64.tar.gz
   tar xvfz alertmanager-*.tar.gz
   cd alertmanager-*
   ./alertmanager
Configure alerts in prometheus.yml and alertmanager.yml.
Real-World Use Cases
- Monitoring CI/CD Pipelines:
Prometheus tracks build durations, test failure rates, and deployment success in Jenkins or GitLab CI, enabling rapid issue detection. - Kubernetes Cluster Monitoring:
Using kube-state-metrics, Prometheus monitors pod health, resource usage, and security events (e.g., failed RBAC policies). - Security Incident Detection:
Integrates with Falco to detect suspicious container activity, such as privilege escalations, and triggers alerts. - Financial Sector Compliance:
Monitors API latency and unauthorized access attempts, ensuring compliance with regulations like PCI-DSS.
Benefits & Limitations
Key Advantages
- Scalable and cloud-native, ideal for microservices.
- Powerful PromQL for flexible querying.
- Extensive ecosystem of exporters and integrations.
- Open-source with strong community support.
Common Challenges or Limitations
- No built-in long-term storage; requires external solutions like Thanos or VictoriaMetrics.
- Steep learning curve for PromQL and configuration.
- Limited support for non-metric data (e.g., logs).
| Limitation | Description |
|---|---|
| No long-term storage | TSDB is designed for short retention; needs remote storage. |
| Pull model only | Pushgateway is a workaround for ephemeral jobs. |
| No built-in anomaly detection | Needs external ML/analytics integration. |
| Learning curve | PromQL and configuration require expertise. |
Best Practices & Recommendations
- Security Tips:
- Use TLS for scrape endpoints.
- Restrict access to Prometheus UI and API with firewalls or authentication.
- Monitor for sensitive data exposure in metrics.
- Performance:
- Optimize scrape intervals to balance load and granularity.
- Use service discovery for dynamic environments.
- Maintenance:
- Regularly update Prometheus and exporters.
- Back up configuration files and use version control.
- Compliance Alignment:
- Configure alerts for compliance violations (e.g., failed audits).
- Use labels to tag metrics for audit trails.
- Automation Ideas:
- Automate alert routing with Alertmanager.
- Use Terraform or Ansible to deploy Prometheus configurations.
Comparison with Alternatives
| Feature | Prometheus | Grafana Tempo | ELK Stack |
|---|---|---|---|
| Data Type | Metrics | Traces | Logs/Metrics |
| Query Language | PromQL | Tempo Query | Lucene/KQL |
| Scalability | High (with external storage) | Moderate | High (complex setup) |
| Ease of Setup | Moderate | Moderate | Complex |
| DevSecOps Fit | Excellent for metrics-driven monitoring | Tracing-focused | Log-centric, broad use |
| When to Choose | Microservices, Kubernetes, metrics focus | Distributed tracing | Log analysis, enterprise |
When to Choose Prometheus: Use Prometheus for metrics-based monitoring and alerting, especially in cloud-native or Kubernetes environments. Choose Tempo for tracing or ELK for log-heavy use cases.
Conclusion
Prometheus is a powerful tool for DevSecOps, offering real-time monitoring, robust alerting, and seamless integration with modern pipelines. Its ability to provide actionable insights into performance and security makes it indispensable. Future trends include tighter integration with AI-driven observability and enhanced long-term storage solutions.