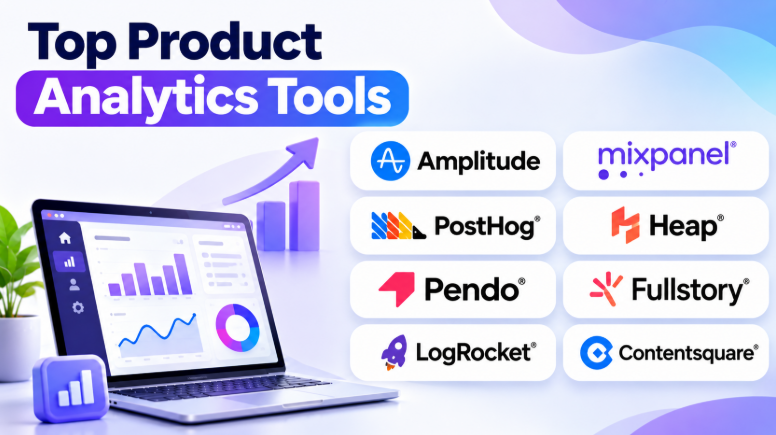
Product teams need more than sign-up numbers and page views to understand their users. They need to know which features people use, where they face problems, and why they stop using a product.
Product analytics tools help teams answer these questions. They collect user activity from websites, mobile applications, and software products. Teams can study user journeys, measure feature adoption, track retention, and identify conversion problems.
Modern product analytics platforms offer several capabilities. These include event tracking, funnel analysis, cohort reports, session replay, heatmaps, and user journey analysis. Some tools also provide experimentation, feature flags, in-app guides, and customer feedback.
However, every platform serves a different purpose. Some focus on detailed behavioral analytics, while others help teams understand user experience or connect analytics with product development.
Choosing the right tool depends on your product type, tracking requirements, technical skills, privacy needs, and budget. This article explores 10 product analytics tools, their features, benefits, limitations, and practical use cases. It also includes comparison tables and guidance to help you select the right platform.
What Are Product Analytics Tools?
Product analytics tools are software applications that collect and analyze how people interact with digital products. These products may include websites, mobile applications, SaaS platforms, and other online services.
They help businesses understand what users do after entering a product. Teams can track actions such as account creation, feature usage, searches, purchases, and subscription renewals.
For example, an online shopping company may notice that many users add products to their carts but do not complete payments. Product analytics can help the team examine the checkout journey and identify where customers leave.
These platforms commonly measure:
- User Activity: Tracks actions such as clicks, searches, downloads, and purchases.
- Feature Adoption: Shows which product features people use and how often they use them.
- Conversion Funnels: Identifies where users leave during a sequence of steps.
- Retention: Measures how often users return to a product.
- User Journeys: Shows the paths people follow before and after important actions.
- Cohort Analysis: Compares groups of users with shared characteristics or behaviors.
- Session Replay: Records user interactions to help teams understand individual experiences.
- Engagement: Measures how frequently and deeply users interact with a product.
Product analytics is useful across several industries. SaaS companies use it to improve feature adoption. E-commerce businesses study shopping journeys. Mobile app developers examine screen activity and retention. Product managers use it to decide which improvements deserve attention.
Top 10 Product Analytics Tools
1. Amplitude
Short Description:
Amplitude is a digital analytics platform that helps businesses understand user behavior across websites and applications. It provides tools for event analysis, funnels, retention, cohorts, and product engagement.
Product managers, growth teams, and data analysts can use Amplitude to study how customers interact with different product features. They can compare user groups, identify conversion problems, and monitor important product metrics.
One of its major strengths is its behavioral analytics capability. Teams can investigate how specific actions relate to engagement and retention. They can also build dashboards to share product performance with other departments.
Amplitude provides session replay and experimentation capabilities within its broader platform. This helps teams connect behavioral reports with user experiences and product changes.
Key Features:
– Event Segmentation: Teams can analyze user actions and group results by event properties. This helps them understand how specific behaviors change across different customer groups.
– Funnel Analysis: Amplitude helps measure conversion through multiple product steps. Teams can identify where users abandon onboarding, registration, or checkout processes.
– Retention Analysis: Users can measure how often customers return after completing an important action. This helps product teams understand long-term engagement.
– Cohort Analysis: Teams can create groups based on user actions or properties. They can compare these groups across different reports and dashboards.
– User Journeys: Journey analysis helps teams understand the actions people take before and after important events.
– Engagement Matrix: Product teams can compare feature adoption and usage frequency. This helps identify popular features and areas that need improvement.
– Dashboards: Users can combine multiple charts into dashboards. Teams can monitor product health and share important findings.
– Experiment Analysis: Available experimentation capabilities help teams measure how product changes affect selected metrics.
Benefits:
- Helps product teams understand detailed user behavior.
- Supports funnel and retention analysis.
- Makes cohort comparisons easier.
- Helps identify product engagement patterns.
- Provides dashboards for cross-team reporting.
- Connects behavioral analysis with product decisions.
- Supports analysis of product experiments.
Pros:
- Strong event-based analytics capabilities.
- Useful funnel and retention reports.
- Supports detailed user segmentation.
- Provides flexible dashboards.
- Suitable for growing product teams.
- Connects several product analytics workflows.
Cons:
- Requires a well-planned event tracking structure.
- Advanced reports may take time to learn.
- Large event volumes can increase costs.
- Teams need clear metric definitions.
- Some capabilities depend on selected plans.
Use Cases:
- SaaS Product Analytics: Measuring feature adoption and customer engagement.
- Mobile App Analysis: Understanding user activity and retention.
- Customer Onboarding: Finding steps where new users leave.
- Growth Analysis: Comparing user groups and conversion behavior.
- Product Experiments: Measuring the impact of product changes.
- Subscription Products: Studying actions associated with repeat usage.
Best For:
- Product managers.
- Growth teams.
- Data analysts.
- SaaS companies.
- Mobile application businesses.
- Organizations that need detailed behavioral analytics.
2. Mixpanel
Short Description:
Mixpanel is a product analytics platform designed to help businesses understand how users interact with websites and applications. It focuses on event tracking, funnels, retention, user flows, and behavioral segmentation.
Product managers can use Mixpanel to investigate specific questions without depending on developers for every report. For example, a team can compare users who complete onboarding with those who leave before reaching the main product features.
Mixpanel provides an interactive analytics environment. Teams can explore events, examine user groups, and create reports around important product activities.
Its combination of behavioral analysis and reporting makes it useful for businesses that want to make product decisions using actual usage data.
Key Features:
– Event Tracking: Mixpanel records user actions such as sign-ups, purchases, searches, and feature interactions. Teams can use these events to measure product activity.
– Funnel Analysis: Users can create funnels to understand how people move through important product processes. This helps identify conversion drop-offs.
– Retention Reports: Retention analysis shows whether users return after performing a selected action. Teams can compare retention across different periods and groups.
– Flows: Flow reports help visualize what users do before or after a selected event. This can reveal unexpected navigation patterns.
– Cohort Analysis: Teams can create behavioral groups and compare their engagement, conversion, and retention.
– User Profiles: User-level information helps teams examine individual activity and understand how people interact with the product.
– Dashboards: Teams can organize charts and reports into shared dashboards for regular product reviews.
– Session Replay and Heatmaps: Available experience analytics features help teams connect user behavior with visual interaction details.
Benefits:
- Helps teams investigate product usage independently.
- Makes funnel analysis easier to understand.
- Supports detailed retention reporting.
- Helps identify common user journeys.
- Provides flexible event-based reporting.
- Supports product and growth decision-making.
- Connects behavioral insights with user experience analysis.
Pros:
- Strong event-based analytics.
- Useful funnels, retention, and flow reports.
- Supports user segmentation.
- Offers interactive reporting.
- Suitable for product and growth teams.
- Helps investigate behavior without writing SQL for every question.
Cons:
- Requires consistent event tracking.
- Complex tracking plans need technical coordination.
- Large datasets may require careful cost management.
- Advanced analysis can take practice.
- Some capabilities depend on the selected subscription.
Use Cases:
- User Onboarding: Measuring how new customers complete registration and setup.
- Feature Adoption: Understanding which product features receive regular usage.
- E-commerce Analytics: Studying shopping, cart, and payment journeys.
- Customer Retention: Comparing repeat usage across customer groups.
- Growth Analysis: Finding behaviors associated with conversion.
- Product Improvement: Identifying actions that need better design or functionality.
Best For:
- Product managers.
- Growth marketers.
- SaaS businesses.
- E-commerce companies.
- Mobile app teams.
- Organizations that need self-service analytics.
3. PostHog
Short Description:
PostHog is an open-source product analytics platform that provides tools for understanding user behavior and improving digital products. It combines product analytics with session replay, feature flags, experiments, surveys, error tracking, and other development-focused capabilities.
Engineering and product teams can use PostHog to collect events and analyze how people use their applications. They can build funnels, retention reports, user journeys, and dashboards.
One of its major advantages is its broad product toolkit. Teams can connect analytics with session recordings, feature releases, and experiments. This can reduce the need to manage several separate tools.
PostHog also offers a self-hosting option. Organizations that want more control over their infrastructure can evaluate this deployment approach alongside its managed cloud offering.
Key Features:
– Product Analytics: Teams can analyze events, trends, funnels, retention, and user journeys. These reports help explain how customers interact with a product.
– Session Replay: Users can watch recorded sessions to understand individual interactions. This can help investigate confusing workflows and unexpected user behavior.
– Feature Flags: Developers can control which users receive specific product features. This supports gradual releases and controlled rollouts.
– Experimentation: Teams can test different product versions and measure their impact on selected metrics.
– Surveys: Product teams can collect feedback from users through surveys. This adds qualitative information to behavioral reports.
– Error Tracking: Developers can investigate application errors and connect technical issues with product activity.
– Dashboards: Teams can organize insights into dashboards and monitor important product metrics.
– Self-Hosting: Organizations can deploy PostHog on infrastructure they manage, subject to its supported deployment requirements.
Benefits:
- Combines analytics with development tools.
- Helps teams connect user behavior with technical issues.
- Supports product experiments and feature releases.
- Provides session replay for experience analysis.
- Offers flexibility through self-hosting.
- Helps reduce dependence on multiple separate tools.
- Supports engineering-led product development.
Pros:
- Broad product development toolkit.
- Open-source foundation.
- Offers cloud and self-hosted deployment options.
- Supports analytics and session replay.
- Includes feature flags and experimentation.
- Useful for engineering-focused teams.
Cons:
- The broad platform can require configuration work.
- Self-hosting needs infrastructure management.
- Teams must monitor data collection and usage.
- Advanced workflows may require technical knowledge.
- Some features have separate usage limits or pricing.
Use Cases:
- SaaS Analytics: Measuring user activity and product engagement.
- Feature Releases: Controlling feature access through flags.
- Application Debugging: Connecting user sessions with errors.
- Product Experiments: Testing changes and measuring outcomes.
- User Experience Analysis: Watching sessions to identify friction.
- Data-Controlled Deployments: Running analytics within managed infrastructure.
Best For:
- Software development teams.
- Engineering-led startups.
- SaaS businesses.
- Product engineers.
- Open-source software users.
- Organizations that want analytics and development tools together.
4. Heap
Short Description:
Heap is a product analytics platform known for automatic data capture. It helps businesses collect user interactions without manually defining every event before data collection begins.
Traditional analytics often requires developers to add tracking code for specific actions. Heap takes a different approach by capturing many interactions automatically. Teams can then define events and analyze collected activity.
This approach is useful when product teams are unsure which interactions they will need to study later. It can also reduce repeated tracking changes when new questions arise.
Heap supports behavioral analysis across websites and applications. Its tools help teams understand conversion, user journeys, engagement, and product adoption.
Key Features:
– Automatic Event Capture: Heap captures supported user interactions, including clicks, page views, and form activity. This can reduce the need for manual event tagging.
– Retroactive Analysis: Teams can define certain events after the data has already been collected. This helps investigate earlier behavior without waiting for new tracking code.
– Event Visualizer: Users can identify and define meaningful interactions from captured activity. This helps organize raw behavioral data into useful events.
– Funnel Analysis: Teams can examine how users move through product processes and identify where they leave.
– User Journeys: Journey analysis helps reveal the paths people take through websites and applications.
– Segmentation: Teams can compare behavior across users with different characteristics or actions.
– Dashboards: Reports can be organized into dashboards to monitor product performance.
– Data Capture Options: Heap supports automatic capture, manual tracking, and server-side events, allowing teams to combine different tracking methods.
Benefits:
- Reduces the need for manual event tagging.
- Helps teams explore previously collected interactions.
- Supports funnel and journey analysis.
- Makes product discovery more flexible.
- Helps identify unexpected user behavior.
- Supports a combination of automatic and custom tracking.
- Useful when product requirements change frequently.
Pros:
- Strong automatic capture approach.
- Supports retroactive event analysis.
- Reduces some engineering tracking work.
- Helps investigate user journeys.
- Supports multiple data capture methods.
- Useful for teams that need flexible analysis.
Cons:
- Automatic capture can produce large amounts of data.
- Teams still need clear event definitions.
- Sensitive information requires careful capture controls.
- Advanced analysis may require training.
- Pricing and usage limits need review before deployment.
Use Cases:
- Website Analysis: Studying clicks, page views, and user interactions.
- Product Discovery: Exploring behavior before deciding which events matter.
- Conversion Analysis: Finding steps where users abandon a process.
- Feature Adoption: Understanding how people interact with product features.
- Customer Journeys: Examining paths through an application.
- Product Research: Investigating unexpected behavior using previously captured data.
Best For:
- Product managers.
- SaaS companies.
- Digital product teams.
- Businesses with changing analytics requirements.
- Teams that want less manual event instrumentation.
- Organizations exploring user behavior.
5. Pendo
Short Description:
Pendo is a product experience platform that combines product analytics with in-app guidance, feedback, and user engagement capabilities. It helps businesses understand how people use their software and guide them toward important features.
Product teams can use Pendo to measure feature adoption, analyze user journeys, and understand which parts of an application receive attention. They can also create in-app guides to support onboarding and explain product workflows.
One of Pendo’s main strengths is connecting analytics with action. Teams can identify users who are not adopting a feature and use targeted guidance to help them discover it.
Pendo is particularly relevant to SaaS businesses and organizations that manage customer-facing or employee-facing software.
Key Features:
– Product Analytics: Pendo helps teams understand how users interact with applications and which features they adopt.
– Feature Usage Tracking: Teams can measure how frequently users access selected product features. This helps identify popular and underused functionality.
– Funnel Analysis: Product managers can examine user journeys and identify where people leave important workflows.
– Retention Analysis: Teams can study how frequently customers return to an application and use its features.
– In-App Guides: Businesses can create contextual messages, walkthroughs, and guidance to help users understand product workflows.
– User Feedback: Feedback capabilities help teams collect customer opinions and product requests.
– Session Replay: Available replay capabilities help connect analytics with individual user experiences.
– Dashboards: Teams can share product metrics and monitor important adoption indicators.
Benefits:
- Connects analytics with in-app guidance.
- Helps improve onboarding experiences.
- Supports feature adoption analysis.
- Makes user feedback easier to collect.
- Helps product teams understand customer behavior.
- Supports customer-facing and employee-facing applications.
- Connects product insights with engagement activities.
Pros:
- Combines analytics and product guidance.
- Useful for onboarding and feature adoption.
- Supports feedback collection.
- Helps teams analyze product usage.
- Provides tools for customer engagement.
- Suitable for business software environments.
Cons:
- May offer more functionality than basic analytics teams need.
- Product tagging and setup require planning.
- Advanced capabilities may depend on selected plans.
- Organizations need to manage guides and messages carefully.
- Teams should evaluate its fit with existing analytics systems.
Use Cases:
- SaaS Onboarding: Helping new customers understand product features.
- Feature Adoption: Measuring and improving the use of important functionality.
- Employee Software Analytics: Understanding how employees use internal applications.
- Customer Feedback: Collecting product suggestions and opinions.
- Product Engagement: Sending targeted in-app guidance.
- Customer Experience: Identifying workflows that need improvement.
Best For:
- SaaS companies.
- Product operations teams.
- Customer success teams.
- Product managers.
- Enterprise software providers.
- Businesses focused on onboarding and feature adoption.
6. Fullstory
Short Description:
Fullstory is a digital experience analytics platform that helps businesses understand how users interact with websites and applications. It combines behavioral analysis with session replay to show both aggregate patterns and individual experiences.
Teams can examine user activity, identify unusual interactions, and investigate problems through session recordings. For example, a product manager may notice that users leave a form before submitting it. Fullstory can help the team inspect recordings to understand what happened.
Its strength is connecting analytics with the actual user experience. Instead of looking only at charts, teams can explore the interactions behind important metrics.
Fullstory is useful for product, design, customer experience, and digital optimization teams.
Key Features:
– Session Replay: Teams can watch recorded user sessions to understand how people interact with a website or application.
– Behavioral Analytics: Fullstory helps identify patterns in clicks, navigation, and other user interactions.
– Event Analysis: Teams can examine user actions and investigate how they relate to product performance.
– Dashboards: Product and experience teams can organize important metrics into dashboards.
– Friction Detection: Behavioral signals can help identify frustrating interactions, such as repeated clicks or actions that do not produce an expected result.
– User Journey Analysis: Teams can investigate the paths people take through digital experiences.
– Search and Segmentation: Users can narrow down behavioral data to find sessions and activity related to specific conditions.
– Team Collaboration: Shared insights help product, design, and engineering teams discuss user experience problems.
Benefits:
- Helps teams understand individual user experiences.
- Connects behavioral data with session recordings.
- Supports usability investigations.
- Helps identify interaction problems.
- Provides insights for product and design teams.
- Makes it easier to investigate customer friction.
- Supports digital experience improvement.
Pros:
- Strong session replay capabilities.
- Useful behavioral analysis.
- Helps investigate user experience issues.
- Connects metrics with individual sessions.
- Suitable for product and customer experience teams.
- Supports collaborative analysis.
Cons:
- Session recordings require careful privacy configuration.
- Large recording volumes need usage management.
- It may not replace a dedicated event analytics platform for every advanced reporting need.
- Teams need to learn how to interpret behavioral signals.
- Available capabilities depend on the selected package.
Use Cases:
- Website Optimization: Finding confusing interactions on important pages.
- Checkout Analysis: Investigating why customers leave before payment.
- Form Improvement: Identifying problems with form completion.
- User Experience Research: Studying real user interactions.
- Product Design: Finding areas that need interface improvements.
- Customer Support: Reviewing sessions to investigate reported problems.
Best For:
- UX designers.
- Product managers.
- Digital experience teams.
- E-commerce businesses.
- Customer experience teams.
- Organizations that need session replay.
7. LogRocket
Short Description:
LogRocket is a product analytics and frontend monitoring platform that helps teams understand user behavior and investigate application problems. It combines product analytics, session replay, and technical debugging information.
Product managers can use its analytics features to study funnels, retention, user paths, and engagement. Developers can inspect session recordings alongside console logs, network activity, and application errors.
This connection between behavioral and technical information is one of its main strengths. For example, if a checkout conversion rate falls, a team can examine the affected sessions and investigate whether a frontend error or network problem contributed to the issue.
LogRocket is particularly useful for web product teams that need to connect user experience with application reliability.
Key Features:
– Product Analytics: Teams can analyze user behavior through trends, funnels, paths, and retention reports.
– Session Replay: Developers and product managers can watch user sessions to understand how people experience an application.
– Frontend Monitoring: Technical information helps teams investigate application behavior and performance problems.
– Console and Network Logs: Session recordings can include technical context such as console activity and network requests.
– Autocapture: LogRocket can capture supported user interactions and make them available for analysis.
– Cohort Analysis: Teams can group users based on behavior, properties, and other conditions.
– Dashboards: Users can create dashboards to monitor product metrics and important trends.
– Alerts: Teams can receive notifications when selected metrics cross configured thresholds.
Benefits:
- Connects product analytics with technical debugging.
- Helps investigate conversion problems.
- Provides context through session replay.
- Supports funnel and retention analysis.
- Helps developers understand frontend issues.
- Reduces the gap between product reports and engineering investigations.
- Supports collaboration between technical and product teams.
Pros:
- Combines analytics and session replay.
- Provides technical context during debugging.
- Supports funnels and user journeys.
- Helps investigate frontend problems.
- Offers dashboards and alerts.
- Useful for web application teams.
Cons:
- Technical features may be unnecessary for teams needing only basic analytics.
- Recording volume can affect costs.
- Session data needs privacy controls.
- Advanced reports require familiarity with the platform.
- Teams should verify mobile support and feature availability for their specific applications.
Use Cases:
- Frontend Debugging: Investigating errors experienced by real users.
- Checkout Optimization: Finding technical issues that affect purchases.
- User Experience Analysis: Watching sessions to understand confusing interactions.
- Conversion Tracking: Measuring user movement through important workflows.
- Application Monitoring: Connecting user activity with technical performance.
- Product Improvement: Prioritizing issues that affect customer experience.
Best For:
- Frontend developers.
- Web application teams.
- Product engineers.
- SaaS companies.
- UX and product teams.
- Businesses that need analytics with debugging context.
8. Contentsquare
Short Description:
Contentsquare is a digital experience analytics platform that helps businesses understand customer behavior across websites and applications. It combines product analytics, journey analysis, heatmaps, session replay, and experience insights.
Organizations can use Contentsquare to understand how visitors move through digital experiences. Teams can study clicks, navigation, conversion, and interaction patterns to identify areas that create friction.
One of its important strengths is its focus on the complete digital customer journey. Businesses can connect user interactions with conversion and revenue-related outcomes.
Contentsquare is particularly useful for larger digital businesses, e-commerce companies, and organizations that manage complex customer journeys.
Key Features:
– Smart Capture: Available capture capabilities collect supported user interactions, helping teams analyze behavior without manually defining every interaction in advance.
– Journey Analysis: Teams can visualize customer paths across digital experiences and identify common navigation patterns.
– Session Replay: Users can watch recorded sessions to understand what happened during individual visits.
– Heatmaps: Heatmaps show interaction patterns, such as clicks and scrolling activity, across pages and screens.
– Friction Analysis: Teams can investigate behaviors that may indicate user frustration, including repeated clicks and areas where users struggle.
– Conversion Analysis: Businesses can examine how user experience affects important conversion steps.
– Impact Analysis: Teams can connect experience findings with business outcomes, such as conversion and revenue.
– Cross-Channel Insights: Available capabilities help organizations study journeys across supported digital channels.
Benefits:
- Helps understand complex customer journeys.
- Connects user experience with business outcomes.
- Supports heatmaps and session replay.
- Helps identify conversion problems.
- Provides behavioral insights for digital teams.
- Supports experience optimization.
- Useful for large websites and digital services.
Pros:
- Strong digital experience analysis.
- Supports journey visualization.
- Provides heatmaps and session replay.
- Helps investigate customer friction.
- Connects experience data with business outcomes.
- Suitable for complex digital environments.
Cons:
- May be more than smaller teams need.
- Advanced implementations can require planning.
- Pricing and package structure need careful review.
- Teams need clear goals to avoid collecting unnecessary data.
- Some capabilities depend on selected product packages.
Use Cases:
- E-commerce Optimization: Studying product discovery and checkout journeys.
- Website Experience: Identifying confusing page interactions.
- Customer Journey Analysis: Understanding how visitors move across digital channels.
- Conversion Improvement: Finding barriers that prevent users from completing actions.
- Digital Banking: Studying customer interactions with online services.
- Experience Research: Connecting behavioral data with individual user sessions.
Best For:
- Large digital businesses.
- E-commerce companies.
- UX research teams.
- Digital marketing teams.
- Customer experience professionals.
- Organizations managing complex online journeys.
9. Countly
Short Description:
Countly is a product analytics platform that helps businesses measure user activity across web, mobile, and other digital products. It provides event analytics, funnels, retention, cohorts, user journeys, dashboards, and performance-related insights.
One of Countly’s main strengths is its focus on data ownership and deployment flexibility. Organizations can evaluate self-hosted and managed deployment options based on their infrastructure and governance requirements.
Countly allows teams to analyze raw product events and use them across different reports. Product managers can study user behavior, while developers can examine crashes and application performance.
It is useful for businesses that want product analytics with additional control over data storage and deployment.
Key Features:
– Event Analytics: Countly helps teams collect and analyze custom events and user activity. Reports can be broken down using event properties.
– Funnels: Teams can create funnels to understand how users move through selected product steps.
– Retention Analysis: Retention reports help measure whether users return after performing important actions.
– Cohorts: Users can create behavioral groups and use them in analysis and engagement workflows.
– User Journeys: Journey reports help identify the paths people take through an application.
– Crash Analytics: Developers can examine application crashes and related technical information.
– Performance Monitoring: Available capabilities help teams investigate application performance and user experience.
– Dashboards and Alerts: Teams can monitor metrics, organize reports, and receive alerts for important changes.
– Deployment Flexibility: Countly offers self-hosted and managed deployment approaches, depending on the product and plan.
Benefits:
- Supports detailed event analysis.
- Helps measure retention and engagement.
- Provides user cohorts and journey reports.
- Connects analytics with crash information.
- Offers deployment flexibility.
- Helps organizations manage product data.
- Supports web and mobile product analysis.
Pros:
- Strong product analytics capabilities.
- Offers self-hosting options.
- Supports event-based reporting.
- Includes funnels and retention analysis.
- Connects behavior with application performance.
- Useful for organizations with data-control requirements.
Cons:
- Self-hosting requires infrastructure and maintenance.
- Advanced configuration may need technical knowledge.
- Teams must plan event tracking carefully.
- Some features depend on product edition.
- Organizations should evaluate integrations before deployment.
Use Cases:
- Mobile App Analytics: Measuring activity across mobile applications.
- Product Engagement: Understanding how users interact with features.
- Retention Analysis: Tracking repeat usage and returning customers.
- Application Monitoring: Investigating crashes and performance issues.
- Data-Controlled Analytics: Managing product data in selected infrastructure.
- Product Development: Connecting behavioral findings with engineering work.
Best For:
- Mobile app developers.
- SaaS businesses.
- Engineering teams.
- Organizations with data governance needs.
- Businesses evaluating self-hosted analytics.
- Companies that need analytics and performance monitoring together.
10. UXCam
Short Description:
UXCam is a product analytics platform focused on mobile applications and websites. It combines behavioral analytics with session replay, heatmaps, funnels, user journeys, and product insights.
Mobile app teams can use UXCam to understand how people interact with screens. It helps track taps, swipes, navigation, and other supported user interactions.
One of its main strengths is connecting quantitative analytics with visual user experiences. For example, a team can identify a drop in checkout completion and inspect relevant session recordings to understand what users experienced.
UXCam supports native and cross-platform mobile development environments, along with web analytics capabilities. It is particularly useful for teams that want to improve mobile app usability and engagement.
Key Features:
– Session Replay: Teams can watch recorded user sessions to understand how people interact with mobile apps and websites.
– Heatmaps: Heatmaps help visualize taps, clicks, swipes, and scrolling activity across supported screens and pages.
– Funnel Analytics: Teams can measure how users move through processes such as onboarding, registration, and checkout.
– User Journeys: Journey analysis helps identify common paths and areas where people leave an application.
– Crash and Issue Analytics: Available capabilities help teams investigate crashes, freezes, and interaction problems.
– Custom Dashboards: Product teams can organize important metrics and monitor product performance.
– Automatic Data Capture: UXCam captures supported user interactions through its SDK and web integration, reducing the need for manual event tagging for many common behaviors.
– AI Product Analysis: Its AI analyst can help identify changes in user behavior and connect findings with relevant session evidence.
Benefits:
- Helps teams understand mobile app behavior.
- Connects analytics with session recordings.
- Supports heatmaps and funnel analysis.
- Helps identify usability problems.
- Provides insights into user journeys.
- Supports mobile and web product experiences.
- Helps product teams investigate conversion problems.
Pros:
- Strong mobile app analytics focus.
- Combines quantitative and qualitative insights.
- Provides session replay and heatmaps.
- Supports funnel and journey analysis.
- Helps investigate user experience problems.
- Supports several mobile development frameworks.
Cons:
- May be less suitable for teams that mainly need advanced warehouse-based analytics.
- Session recordings require privacy controls.
- Teams should verify supported frameworks and SDK requirements.
- Usage and retention limits need review.
- Some advanced capabilities may depend on the selected plan.
Use Cases:
- Mobile App Analytics: Understanding how users interact with mobile screens.
- Onboarding Analysis: Finding steps where new users stop.
- Checkout Optimization: Investigating payment and purchase drop-offs.
- App Usability: Identifying confusing navigation and interface elements.
- Crash Investigation: Understanding the user experience around application issues.
- Feature Adoption: Measuring how people use important app features.
Best For:
- Mobile app developers.
- Product managers.
- UX designers.
- Mobile-first businesses.
- E-commerce app teams.
- Organizations focused on app usability.
Comparison Table: Top 10 Product Analytics Tools
| Tool Name | Best For | Main Capabilities | Standout Feature | Deployment or Approach |
|---|---|---|---|---|
| Amplitude | Detailed behavioral analytics | Funnels, cohorts, retention, journeys | Advanced product analysis | Cloud platform |
| Mixpanel | Self-service product analytics | Events, funnels, flows, retention | Interactive event analysis | Cloud platform |
| PostHog | Engineering-led product teams | Analytics, replay, flags, experiments | Broad development toolkit and self-hosting | Cloud and self-hosted options |
| Heap | Automatic data capture | Autocapture, funnels, journeys | Retroactive event analysis | Cloud platform |
| Pendo | Product adoption and onboarding | Analytics, guides, feedback | Analytics connected with in-app guidance | Cloud platform |
| Fullstory | Digital experience analysis | Session replay, behavioral insights | Visual investigation of user behavior | Cloud platform |
| LogRocket | Product analytics and debugging | Funnels, replay, monitoring | Technical context during session replay | Cloud platform |
| Contentsquare | Complex digital customer journeys | Journey analysis, heatmaps, replay | Experience insights connected with business outcomes | Cloud platform |
| Countly | Data-control-focused analytics | Events, funnels, cohorts, crashes | Self-hosted deployment options | Cloud and self-hosted options |
| UXCam | Mobile app analytics | Replay, heatmaps, funnels, journeys | Visual mobile interaction analysis | Cloud platform |
Note: Features, deployment options, usage limits, and pricing can vary by plan and product edition. Confirm current availability with each vendor before making a purchase decision.
Which Product Analytics Tool Is Right for You?
Choosing the right product analytics platform depends on your application, team structure, tracking needs, and business goals. A mobile app startup may need session replay and screen analytics. A large SaaS company may need advanced event analysis, retention reporting, and data governance.
Here is a practical selection guide.
For Beginners and Small Product Teams: Mixpanel and PostHog
Mixpanel is useful for teams that want to create event-based reports and explore funnels, retention, and user flows.
PostHog is another option for smaller teams, especially when developers want analytics alongside feature flags, experiments, and session replay.
Choose Mixpanel when self-service behavioral analysis is your main priority. Choose PostHog when you want a broader product development toolkit.
For Detailed Behavioral Analytics: Amplitude and Mixpanel
Amplitude and Mixpanel are strong options for organizations that need to study product behavior in detail.
Both support event analysis, funnels, retention, and user segmentation. They help product managers understand how users interact with different features.
Amplitude is worth evaluating for its range of behavioral analysis and engagement reports. Mixpanel is useful for teams that want interactive, self-service event analytics.
For Automatic Event Tracking: Heap and Pendo
Heap is useful when teams want to capture supported user interactions automatically and define events later.
Pendo also emphasizes automatic product data collection, while connecting analytics with in-app guides and feedback.
Choose Heap when flexible behavioral data capture is important. Choose Pendo when product onboarding and adoption are equally important.
For Engineering and Application Debugging: PostHog and LogRocket
PostHog connects product analytics with feature flags, experiments, session replay, and error tracking.
LogRocket combines product analytics with session replay and frontend technical information. It helps developers investigate problems in the context of real user sessions.
Choose PostHog for a broader product development environment. Choose LogRocket when frontend debugging and user experience analysis are major priorities.
For User Experience and Session Replay: Fullstory and Contentsquare
Fullstory and Contentsquare help teams understand how users interact with digital experiences.
Fullstory is useful for investigating individual sessions and behavioral friction. Contentsquare is worth evaluating when a business needs broader journey analysis and experience insights across complex digital channels.
For Data Ownership and Self-Hosting: Countly and PostHog
Some organizations need more control over where product data is stored and how analytics infrastructure is managed.
Countly and PostHog both offer self-hosting options. These approaches can support specific governance and infrastructure requirements, but they also create operational responsibilities.
Choose based on deployment requirements, maintenance capacity, security controls, and the technical skills available within your team.
For Mobile App Analytics: UXCam and Countly
UXCam focuses strongly on mobile app behavior, screen interactions, session replay, and heatmaps.
Countly provides mobile analytics alongside broader event, retention, cohort, and performance reporting.
Choose UXCam when visual app interaction analysis is important. Choose Countly when you also need broader analytics and deployment flexibility.
Best Product Analytics Tools for Different Users
| User Type | Recommended Software | Why? |
|---|---|---|
| Beginners | Mixpanel | Accessible event-based analysis |
| Product Managers | Amplitude | Detailed behavioral insights |
| Growth Teams | Mixpanel | Funnels, flows, and retention |
| Engineering Teams | PostHog | Analytics with development tools |
| SaaS Companies | Amplitude / Pendo | Product usage and adoption analysis |
| Mobile App Developers | UXCam | Session replay and screen analytics |
| UX Designers | Fullstory | Visual user experience investigation |
| Frontend Developers | LogRocket | Analytics with debugging context |
| Large Digital Businesses | Contentsquare | Complex journey and experience analysis |
| Data-Control-Focused Teams | Countly | Self-hosting and data management options |
Key Benefits of Using Product Analytics Tools
Product analytics helps teams replace assumptions with measurable user behavior. It also makes it easier to identify which product improvements deserve attention.
1. Better Understanding of User Behavior
Analytics tools show how people interact with a product. Teams can understand which features receive attention and which workflows create problems.
This information helps product managers make decisions based on actual usage patterns.
2. Improved Product Adoption
A new feature may be useful, but users may not know how to find it. Product analytics helps teams measure feature usage and identify groups that have not adopted important functionality.
Teams can then improve navigation, onboarding, and product communication.
3. Higher Conversion Opportunities
Funnels help businesses understand where people leave important processes. For example, an online service can measure the steps between registration and payment.
Teams can use these findings to investigate confusing forms, unnecessary steps, or technical problems.
4. Better Customer Retention
Retention reports show whether customers return after their first interaction. Teams can compare user groups and identify behaviors associated with repeat usage.
This helps businesses understand which product experiences may encourage long-term engagement.
5. More Informed Product Decisions
Product teams often have limited development resources. Analytics helps them identify problems and prioritize improvements based on user behavior.
It does not automatically prove which change will work, but it gives teams better evidence for deciding what to investigate and test.
6. Stronger Collaboration Between Teams
Product analytics can help product managers, designers, developers, and business teams work with shared information.
Dashboards and reports make it easier to discuss product performance and agree on improvement priorities.
How to Implement Product Analytics Successfully
Selecting a platform is only the first step. Teams also need a clear plan for collecting, organizing, and using product data.
Step 1: Define Your Product Goals
Start by identifying what you want to understand.
Your goals may include:
- Improving user onboarding.
- Increasing feature adoption.
- Reducing checkout abandonment.
- Measuring customer retention.
- Understanding subscription usage.
- Finding application usability problems.
Choose a few important questions instead of tracking everything immediately.
Step 2: Create an Event Tracking Plan
List the important actions users take inside your product.
For example, a subscription application may track:
- Account created
- Onboarding completed
- Trial started
- Feature used
- Subscription selected
- Payment completed
- Subscription cancelled
Define each event clearly. Decide which properties should be attached to it, such as product plan, device type, or account category.
This helps prevent inconsistent tracking across teams.
Step 3: Select the Right Analytics Platform
Compare platforms based on your requirements.
Check their SDK support, event capture methods, reporting capabilities, privacy controls, integrations, and deployment options.
Do not choose a platform only because it offers the largest number of features. Focus on the reports and workflows your team will actually use.
Step 4: Install and Validate Tracking
Add the required SDK, script, or server-side integration to your application.
Then test important events. Confirm that they fire at the correct time and contain accurate properties.
Check identity handling carefully. A user who browses anonymously and later signs in should not automatically appear as two unrelated people when your tracking model is designed to connect those activities.
Step 5: Build Useful Reports
Create reports around your most important product questions.
For example:
- A funnel for user registration.
- A retention report for returning customers.
- A cohort report for users who adopted a feature.
- A journey report for checkout behavior.
- A dashboard for product engagement.
Keep the first reports simple. Add more detail when the team has a clear reason.
Step 6: Review Privacy and Data Security
Product analytics can collect information about real people. Teams must control what they capture and who can access it.
Before launch, review:
- Consent and tracking requirements.
- Sensitive data masking.
- Access permissions.
- Data retention settings.
- User deletion requests.
- Data export controls.
- Vendor security documentation.
- Applicable privacy obligations.
Session replay needs particular care. Avoid recording sensitive form fields and private information unless the collection is appropriate, lawful, and properly protected.
Step 7: Turn Insights Into Product Improvements
Analytics is valuable only when teams use its findings.
If a funnel shows a large drop during onboarding, investigate the affected step. Review relevant sessions, check technical errors, and speak with users when needed.
Then make a focused improvement and measure what changes.
Remember that a correlation between a feature and retention does not prove that the feature caused better retention. Use suitable experiments when you need to test cause and effect.
Frequently Asked Questions (FAQs)
1. What is product analytics software?
Product analytics software collects and analyzes how people use websites, mobile applications, and digital products.
It helps teams measure events, feature adoption, conversion, retention, and user journeys. Businesses use these insights to improve product experiences and make better decisions.
2. Which product analytics tool is best?
The right tool depends on your requirements.
Amplitude and Mixpanel are useful for behavioral analytics. PostHog combines analytics with development tools. Pendo connects product usage with in-app guidance. UXCam focuses on mobile app experience analysis.
Compare the tools against your actual workflows before selecting one.
3. What is the difference between product analytics and web analytics?
Web analytics mainly measures website traffic, acquisition sources, page views, and visitor activity.
Product analytics focuses on how people use a product after they arrive. It measures feature adoption, user journeys, conversion, and retention.
Many businesses use both types of analytics.
4. Are product analytics tools useful for mobile applications?
Yes. Many product analytics platforms support mobile applications.
They can measure screen activity, user events, feature usage, and retention. Tools such as UXCam and Countly also provide capabilities for studying mobile user experiences and application performance.
Check the SDK and framework support before selecting a platform.
5. What is event tracking in product analytics?
Event tracking records specific actions that users perform inside an application.
Examples include creating an account, clicking a button, completing a purchase, or using a feature.
Teams analyze these events to understand user behavior and measure important product outcomes.
6. What is session replay?
Session replay records supported user interactions and allows teams to review them later.
It can show clicks, navigation, scrolling, and other activity. Some platforms also connect recordings with technical details.
Session replay helps teams investigate usability problems that may not be clear from charts alone.
7. Can product analytics tools improve customer retention?
They can help teams understand retention patterns and identify behaviors associated with repeat usage.
Teams can compare user groups, examine feature adoption, and investigate why customers stop returning.
However, analytics alone cannot guarantee better retention. Businesses must use the findings to improve the product and test the results.
8. Are there free product analytics tools?
Some platforms offer free plans, open-source options, or limited usage allowances.
PostHog and Countly provide open-source or self-hosting options. Other vendors may offer free plans or trials with specific limits.
Review event allowances, feature restrictions, data retention, and deployment requirements before choosing a free option.
Final Thoughts
Product analytics tools help businesses understand how people use digital products. They provide useful information about feature adoption, user journeys, conversion, and retention.
Each platform has a different strength. Amplitude and Mixpanel are useful for detailed behavioral analysis. PostHog connects analytics with product development tools. Heap focuses on automatic data capture, while Pendo connects analytics with in-app guidance.
Fullstory and Contentsquare help teams investigate digital experiences. LogRocket connects user behavior with frontend debugging. Countly offers deployment flexibility, while UXCam focuses strongly on mobile app analytics and session replay.
Before selecting a platform, define your product goals and tracking requirements. Check event collection, integrations, privacy controls, reporting, and long-term costs. Test the shortlisted tools with a real user journey before making a commitment.
The best product analytics tool is not simply the one with the most features. It is the one that helps your team understand user behavior, identify meaningful problems, and make better product decisions.






Leave a Reply
You must be logged in to post a comment.